Fig. 7
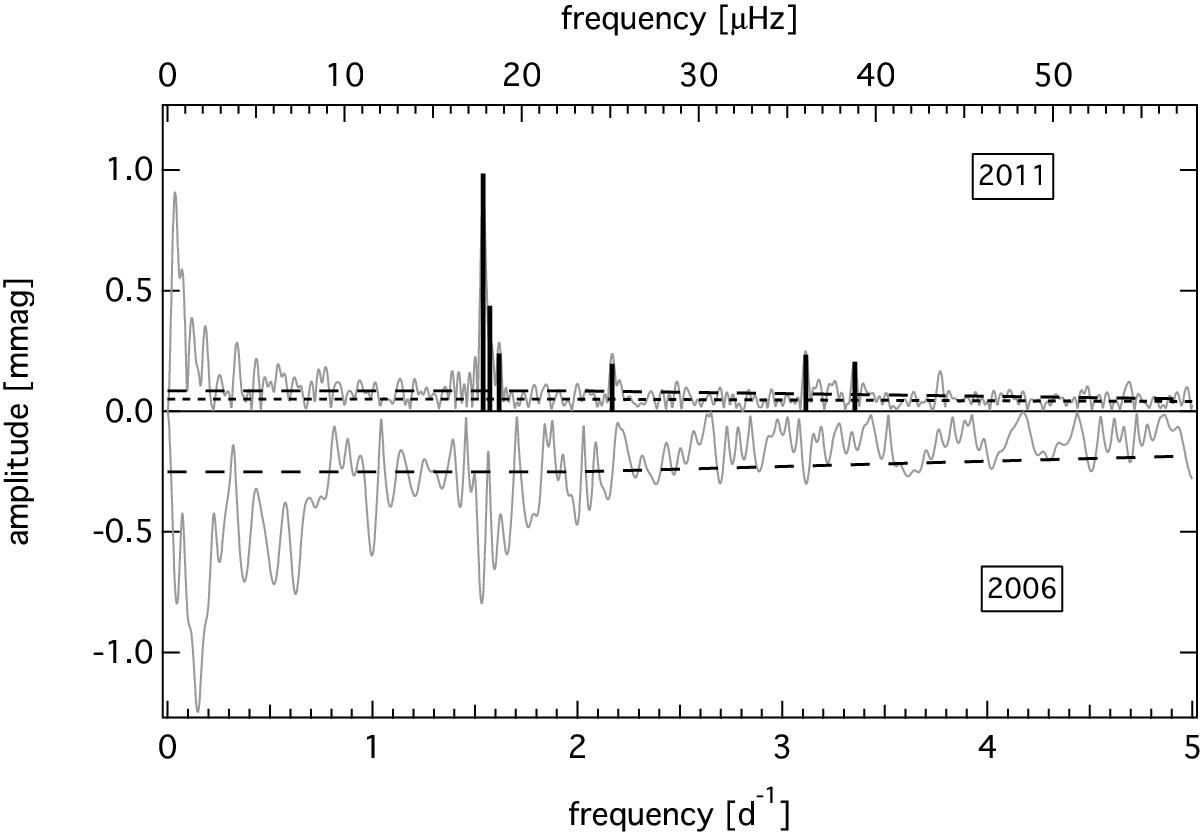
Amplitude spectra for HD 261878 obtained from MOST data 2006 (pointing downwards) and 2011/12 (pointing upwards). Dashed lines mark the noise spectrum for the original 2006 and 2011/12 data, respectively; the dotted line shows the noise spectrum of the residuals of the 2011/12 data set after prewhitening all significant frequencies.
Current usage metrics show cumulative count of Article Views (full-text article views including HTML views, PDF and ePub downloads, according to the available data) and Abstracts Views on Vision4Press platform.
Data correspond to usage on the plateform after 2015. The current usage metrics is available 48-96 hours after online publication and is updated daily on week days.
Initial download of the metrics may take a while.