Fig. 9
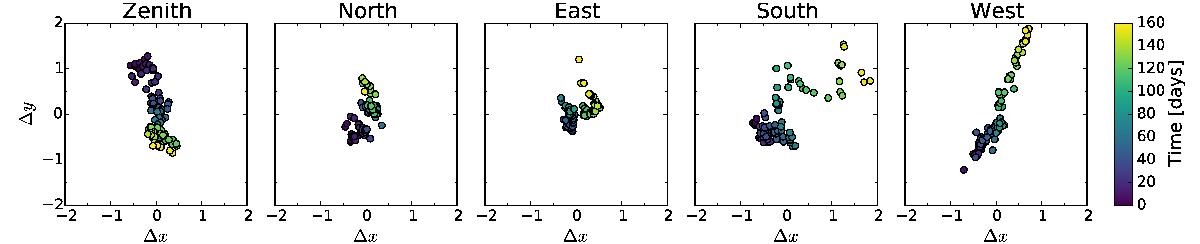
Change in the pointing of the cameras of the northern station during a 160 day period between July 16 2015 and December 23 2015. Each panel shows the mean subtracted x,y position of a particular star at a fixed sidereal time, chosen such that its location is close to the centre of the CCD. The panels show drifts in the pointing of the individual cameras of 1−2 pixels over this five months period.
Current usage metrics show cumulative count of Article Views (full-text article views including HTML views, PDF and ePub downloads, according to the available data) and Abstracts Views on Vision4Press platform.
Data correspond to usage on the plateform after 2015. The current usage metrics is available 48-96 hours after online publication and is updated daily on week days.
Initial download of the metrics may take a while.