Fig. 5
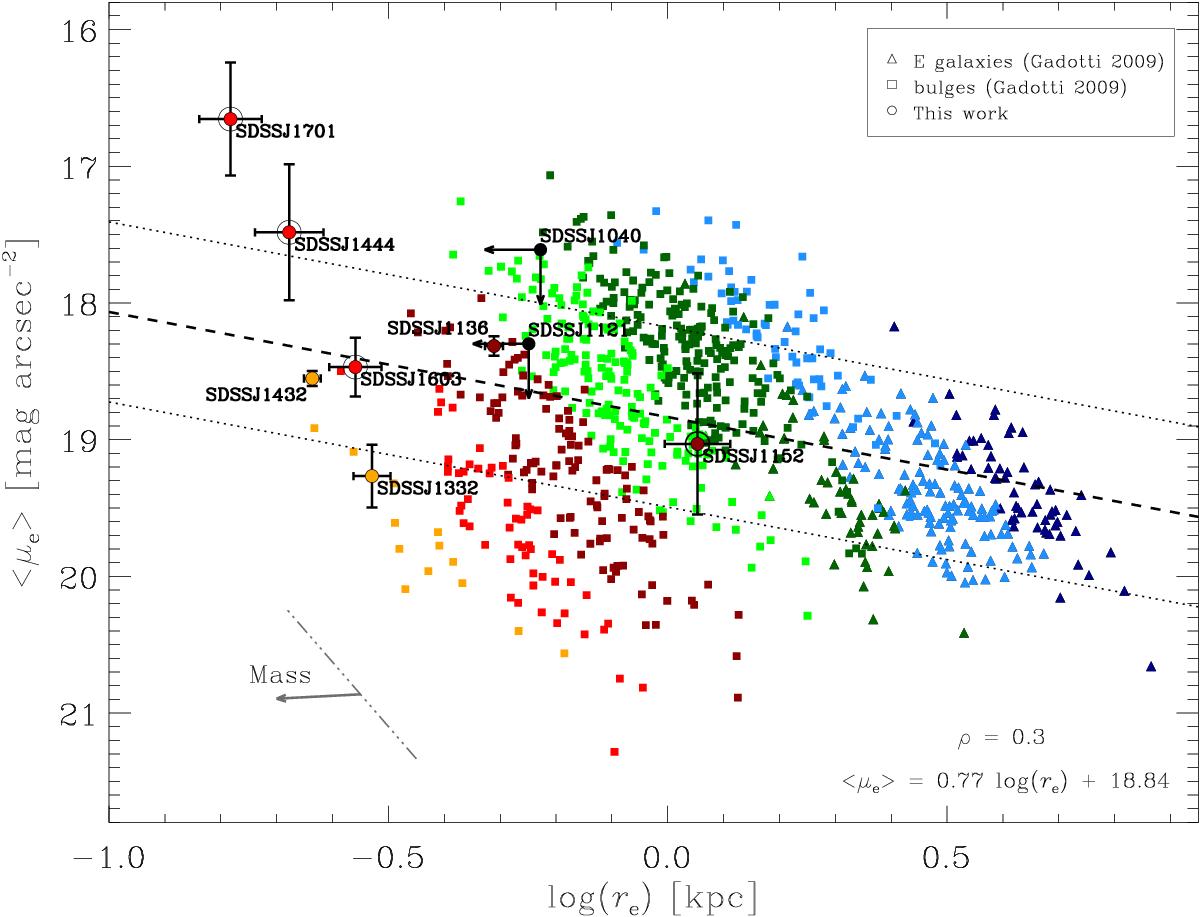
Kormendy relation for the galaxies of our (larger symbols) and comparison sample (smaller symbols). The ellipticals and bulges of the comparison sample are shown with triangles and squares, respectively. Filled circles with and without error bars correspond to the galaxies in our sample with and without bulge, respectively. Open circles indicate the barred galaxies. The galaxies are divided according to their absolute magnitude in the following bins: Mi< −22 mag (dark blue), Mi = [−22,−21] mag (light blue), Mi = [−21,−20] mag (dark green), Mi = [−20,−19] mag (light green), Mi = [−19,−18] mag (dark red), Mi = [−18,−17] mag (light red), and Mi = [−17,−16] mag (orange). The dashed line is the best-fitting relation for the comparison sample. The dotted lines show the rms deviation in ⟨ μe ⟩ from the fit. The dash-dotted line gives the slope of the KR for the magnitude bin Mi = [−20,−19] mag, while the arrow indicates the KR trend for decreasing masses (Nigoche-Netro et al. 2008). The best-fitting relation and Pearson correlation coefficient are also given.
Current usage metrics show cumulative count of Article Views (full-text article views including HTML views, PDF and ePub downloads, according to the available data) and Abstracts Views on Vision4Press platform.
Data correspond to usage on the plateform after 2015. The current usage metrics is available 48-96 hours after online publication and is updated daily on week days.
Initial download of the metrics may take a while.