Fig. 4
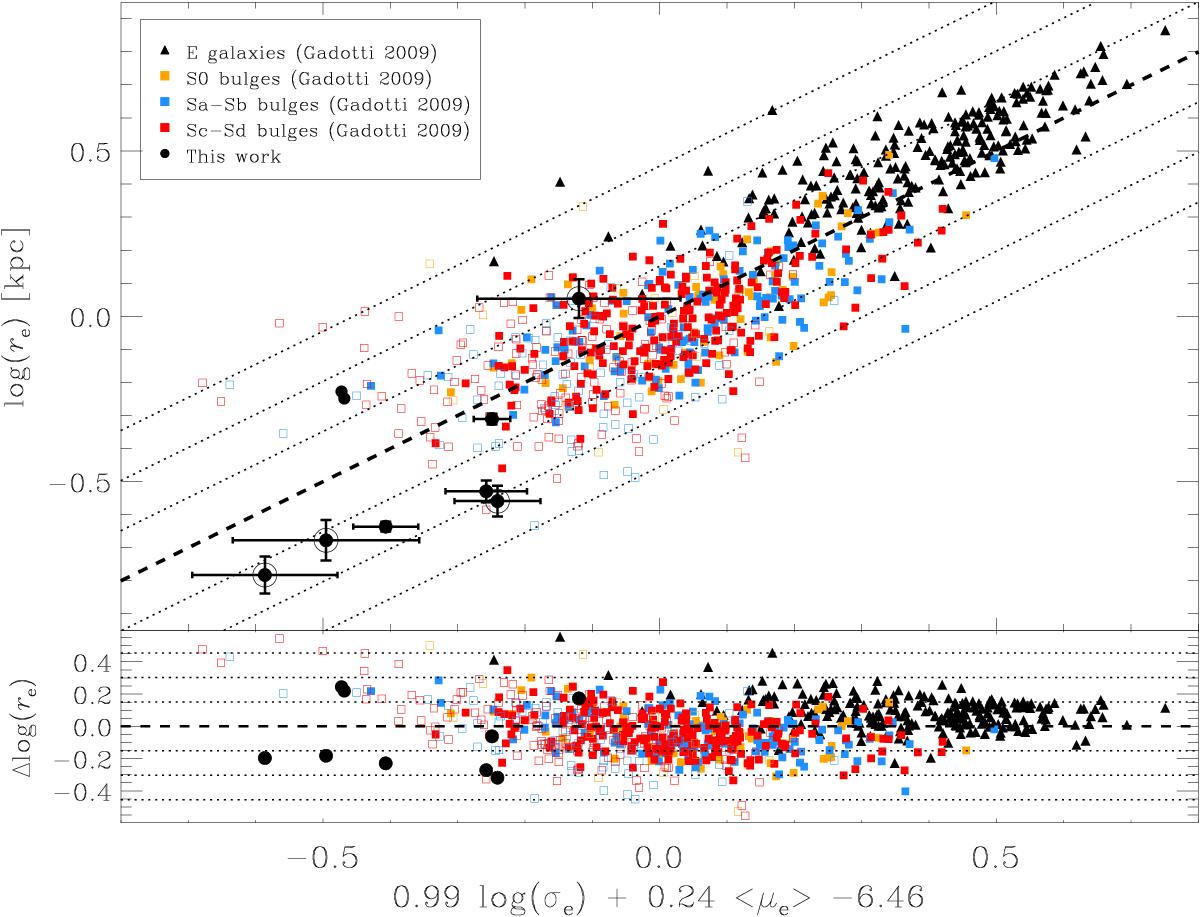
Fundamental plane relation for the galaxies of our (larger symbols) and comparison sample (smaller symbols). The ellipticals (black triangles) and bulges in S0 (orange squares), Sa-Sb (blue squares), and Sc-Sd galaxies (red squares) of the comparison sample are shown with filled (σ > 70 km s-1) and empty symbols (σ < 70 km s-1) according to their calculated velocity dispersion. Filed circles with and without error bars correspond to the galaxies in our sample with and without bulge, respectively. Open circles denote the barred galaxies. The dashed line is the best-fitting relation for the comparison sample. The dotted lines show the 1 rms, 2 rms, and 3 rms deviation in log (re) regions, respectively.
Current usage metrics show cumulative count of Article Views (full-text article views including HTML views, PDF and ePub downloads, according to the available data) and Abstracts Views on Vision4Press platform.
Data correspond to usage on the plateform after 2015. The current usage metrics is available 48-96 hours after online publication and is updated daily on week days.
Initial download of the metrics may take a while.