Fig. 3
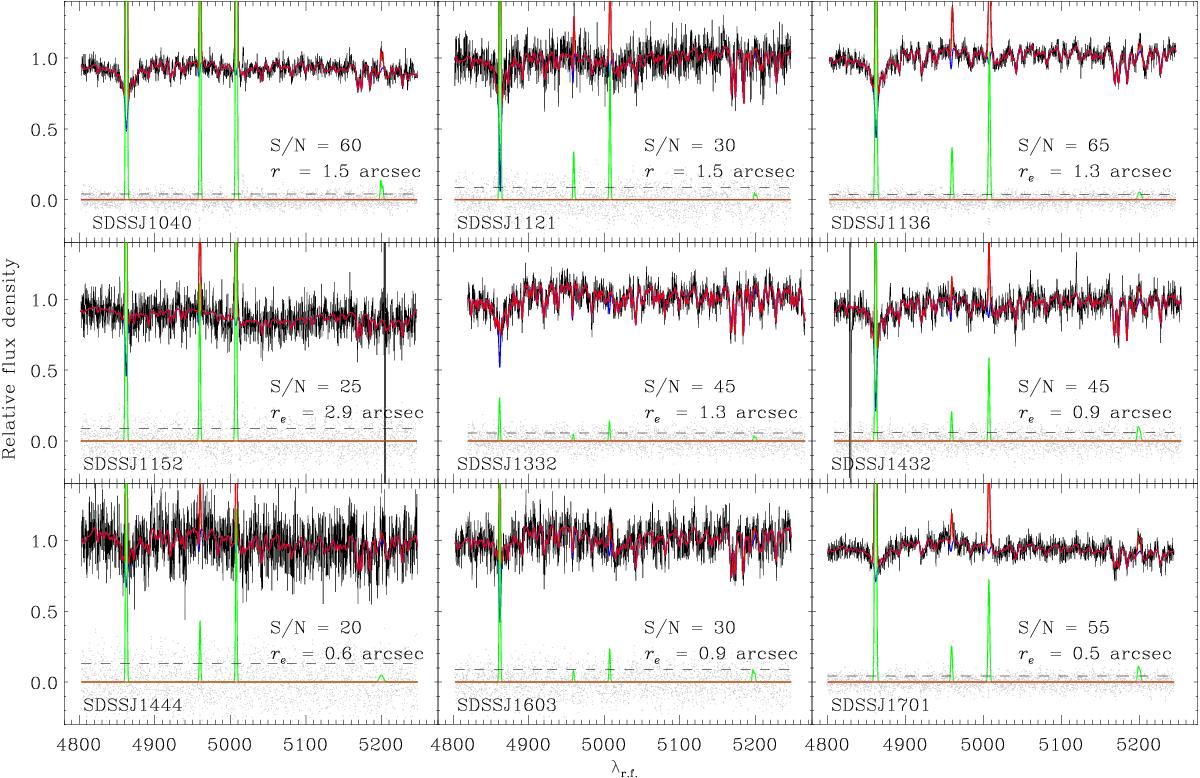
Spectra of the sample galaxies. Relative fluxes have false zero points for viewing convenience. In each panel the best-fitting model (red line) is the sum of the spectra of the ionized gas (green line) and stellar component (blue line). The residuals (gray dots) are obtained by subtracting the best-fitting model from the observed spectrum. The S/N is given per resolution element.
Current usage metrics show cumulative count of Article Views (full-text article views including HTML views, PDF and ePub downloads, according to the available data) and Abstracts Views on Vision4Press platform.
Data correspond to usage on the plateform after 2015. The current usage metrics is available 48-96 hours after online publication and is updated daily on week days.
Initial download of the metrics may take a while.