Free Access
Fig. A.2
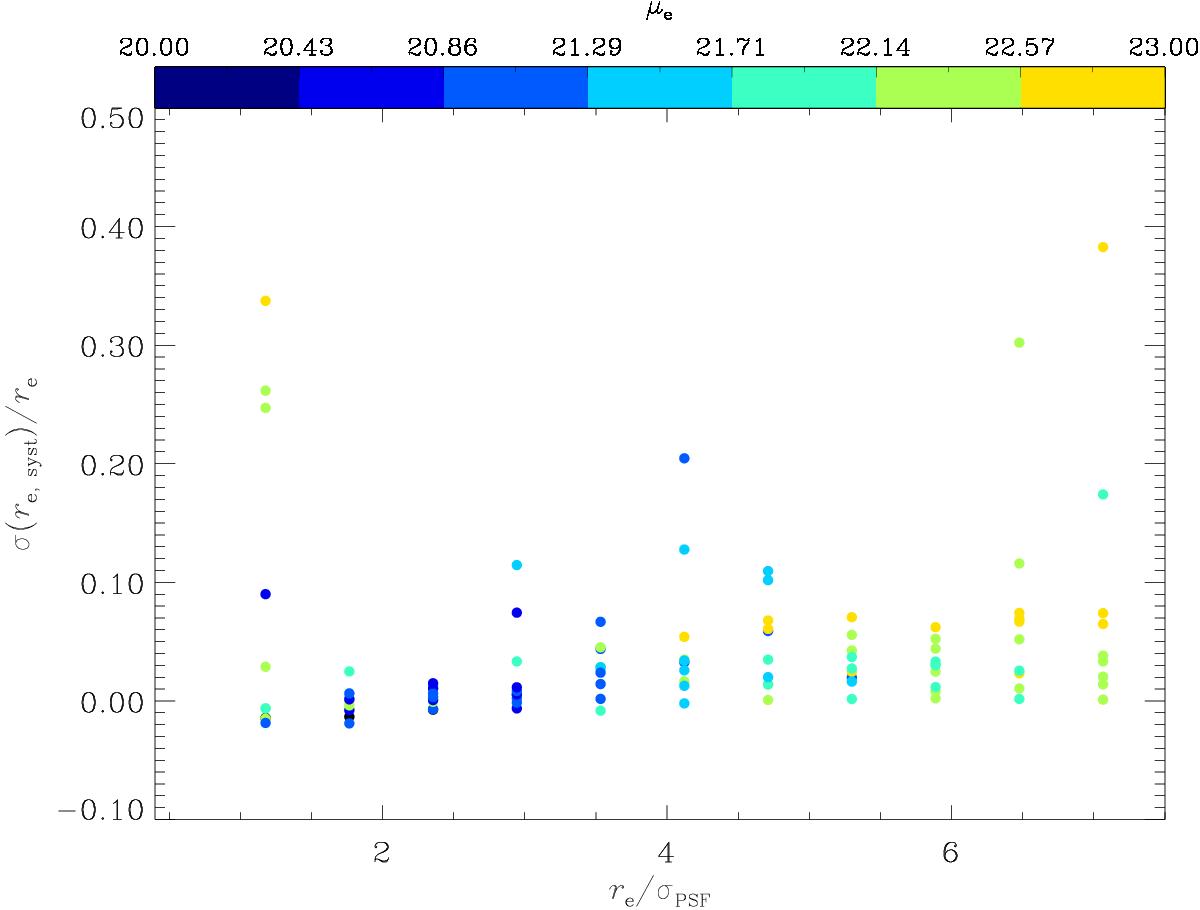
Relative difference between re, output and re, input as function of re/σPSF adopting h = 5.6 arcsec. Positive/negative values correspond to an over/underestimation of re. The different values of μe are shown in different colors.
Current usage metrics show cumulative count of Article Views (full-text article views including HTML views, PDF and ePub downloads, according to the available data) and Abstracts Views on Vision4Press platform.
Data correspond to usage on the plateform after 2015. The current usage metrics is available 48-96 hours after online publication and is updated daily on week days.
Initial download of the metrics may take a while.