Fig. 6
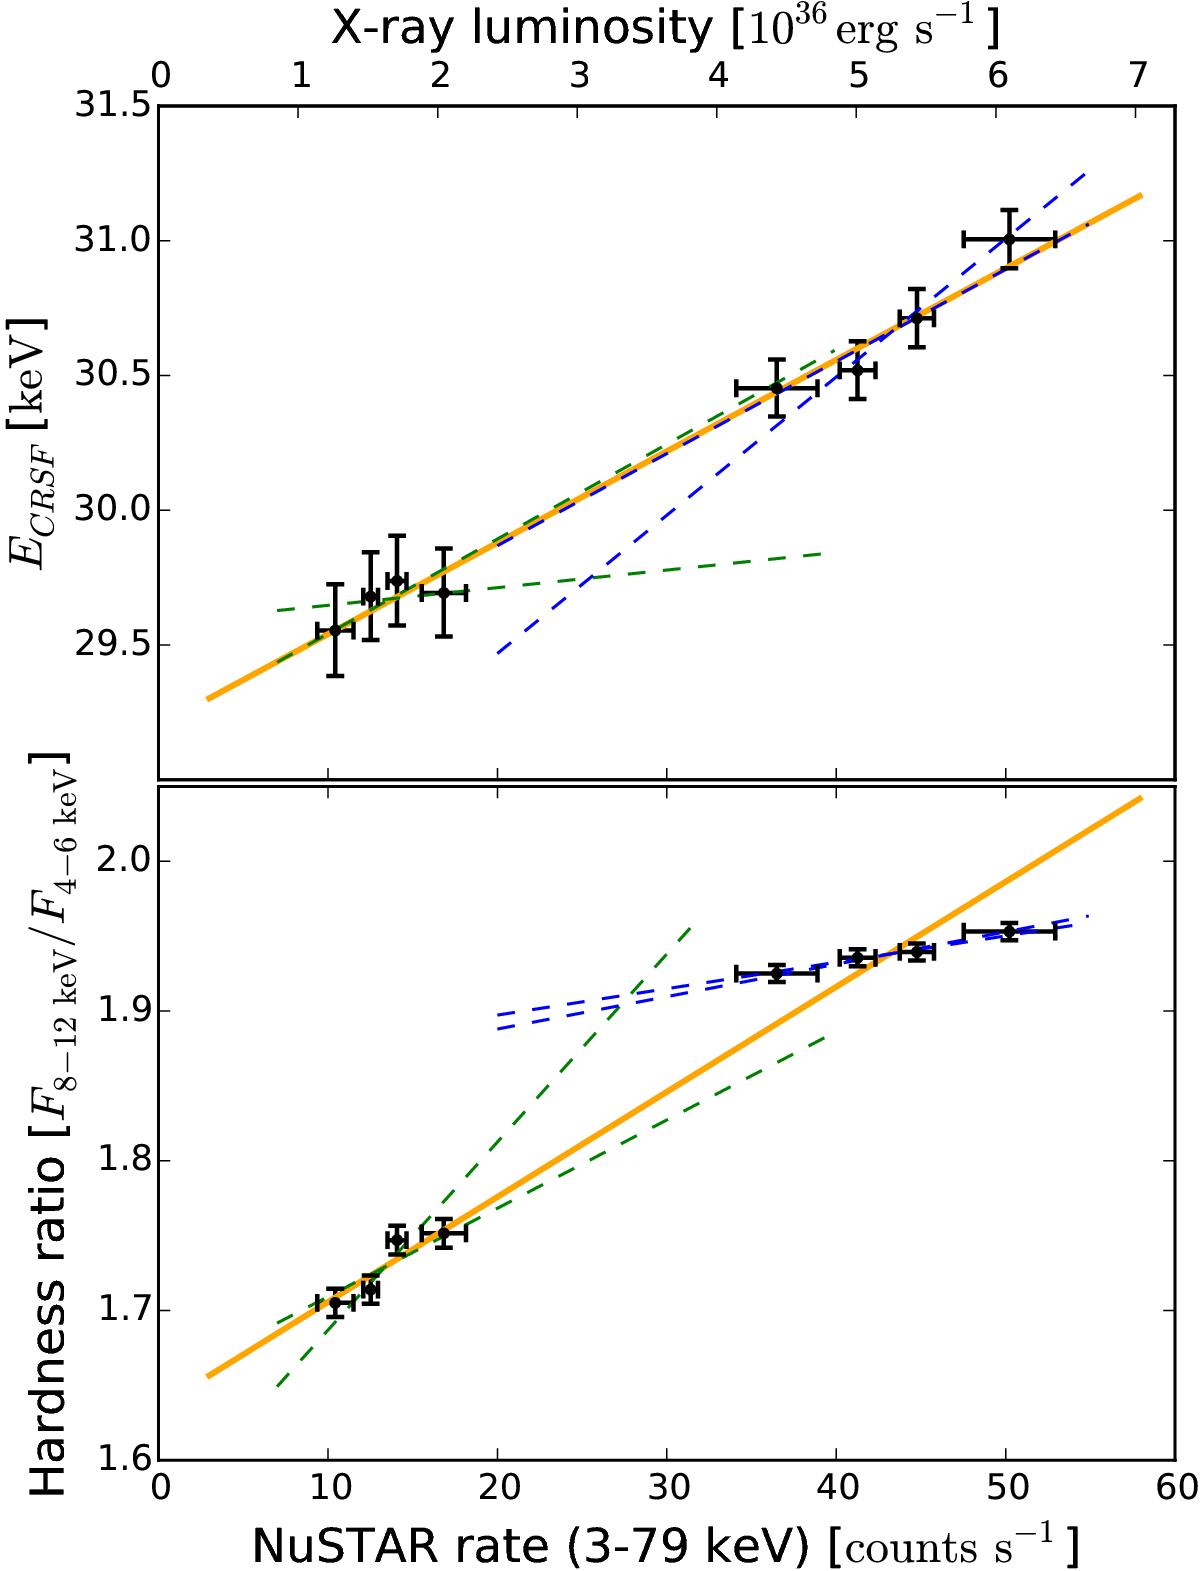
Fundamental CRSF centroid energy (top) and the spectral hardness ratio (bottom) of Cep X-4 as a function of pulse amplitude, which is converted to luminosity on the top axis. The orange solid line represents a common linear fit to the data points for the two observations. The dashed lines mark 1σ cones of the allowed slope ranges from the separate fits to the two observations.
Current usage metrics show cumulative count of Article Views (full-text article views including HTML views, PDF and ePub downloads, according to the available data) and Abstracts Views on Vision4Press platform.
Data correspond to usage on the plateform after 2015. The current usage metrics is available 48-96 hours after online publication and is updated daily on week days.
Initial download of the metrics may take a while.