Free Access
Fig. 4
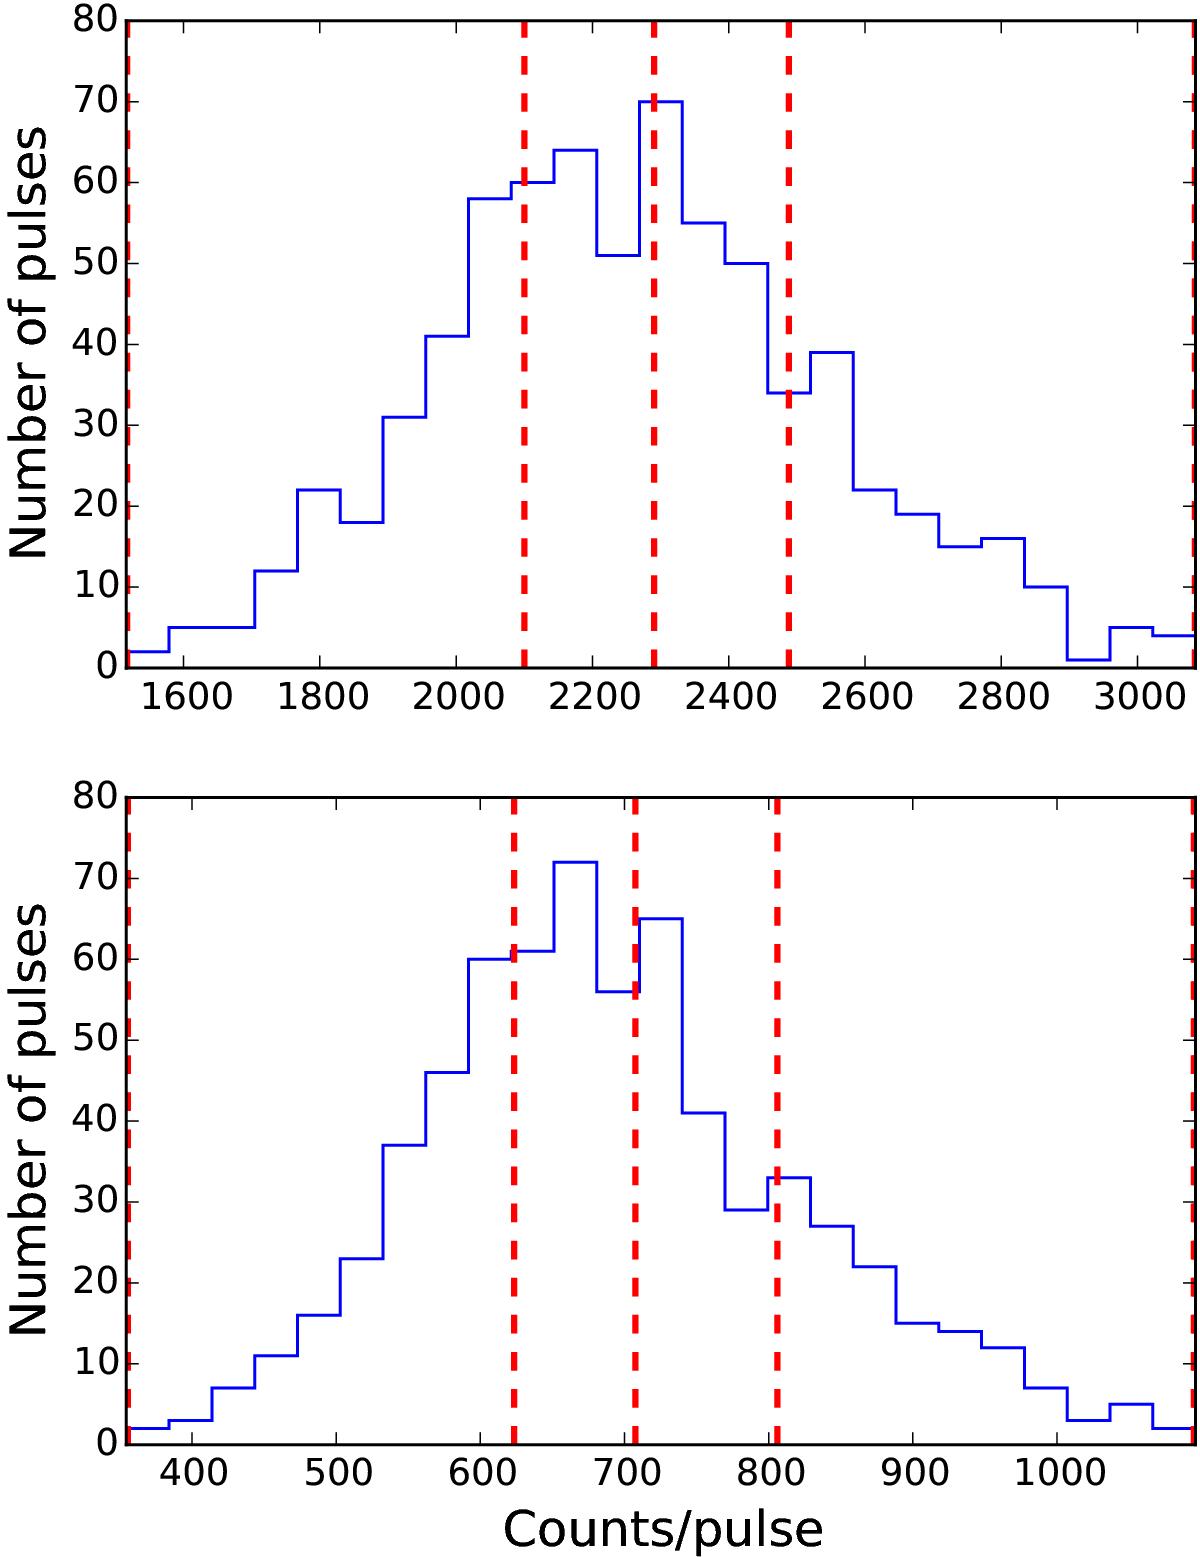
Distributions of counts in individual pulse (i.e. of pulse amplitudes) for observations I (top) and II (bottom). The red dashed lines indicate the boundaries of the amplitude bins we used to extract amplitude-resolved spectra. In each distribution, the total number of counts is evenly distributed among the bins.
Current usage metrics show cumulative count of Article Views (full-text article views including HTML views, PDF and ePub downloads, according to the available data) and Abstracts Views on Vision4Press platform.
Data correspond to usage on the plateform after 2015. The current usage metrics is available 48-96 hours after online publication and is updated daily on week days.
Initial download of the metrics may take a while.