Free Access
Fig. 3
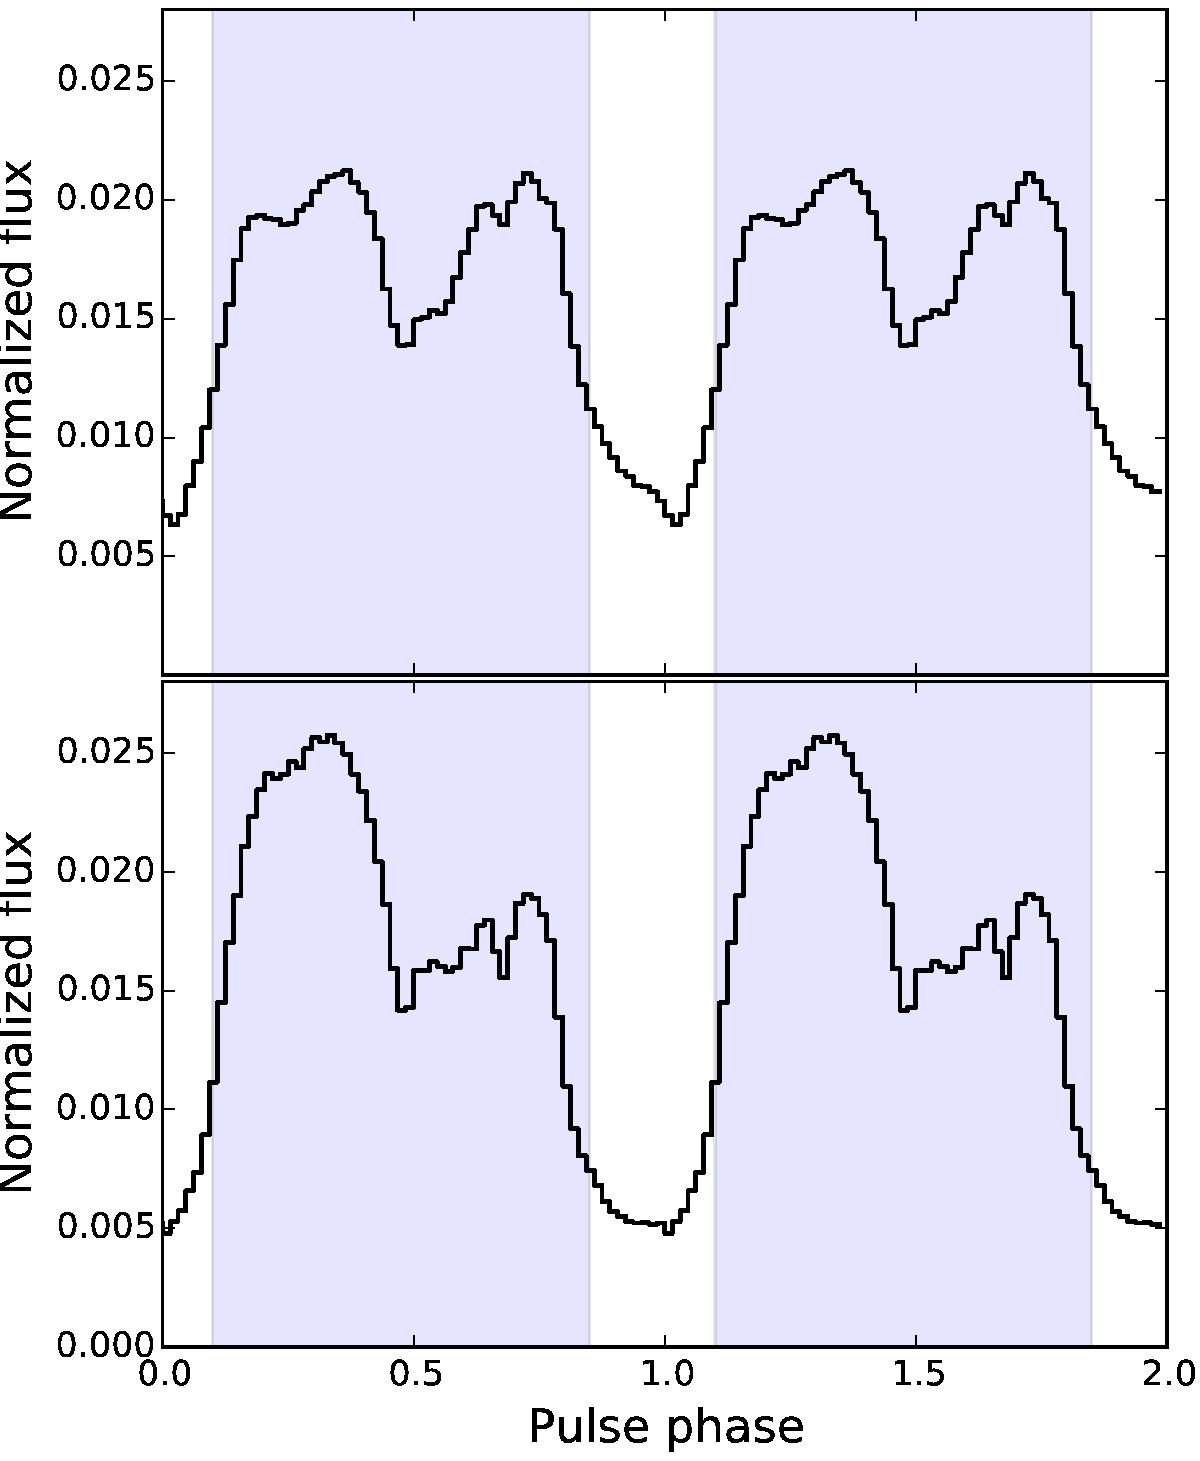
NuSTAR pulse profiles in the 3–79 keV energy range from observations I (top) and II (bottom). The shaded areas indicate the phase interval considered for the pulse-to-pulse analysis. The part of the profile within the interval is referred to as pulse (see text).
Current usage metrics show cumulative count of Article Views (full-text article views including HTML views, PDF and ePub downloads, according to the available data) and Abstracts Views on Vision4Press platform.
Data correspond to usage on the plateform after 2015. The current usage metrics is available 48-96 hours after online publication and is updated daily on week days.
Initial download of the metrics may take a while.