Fig. 2
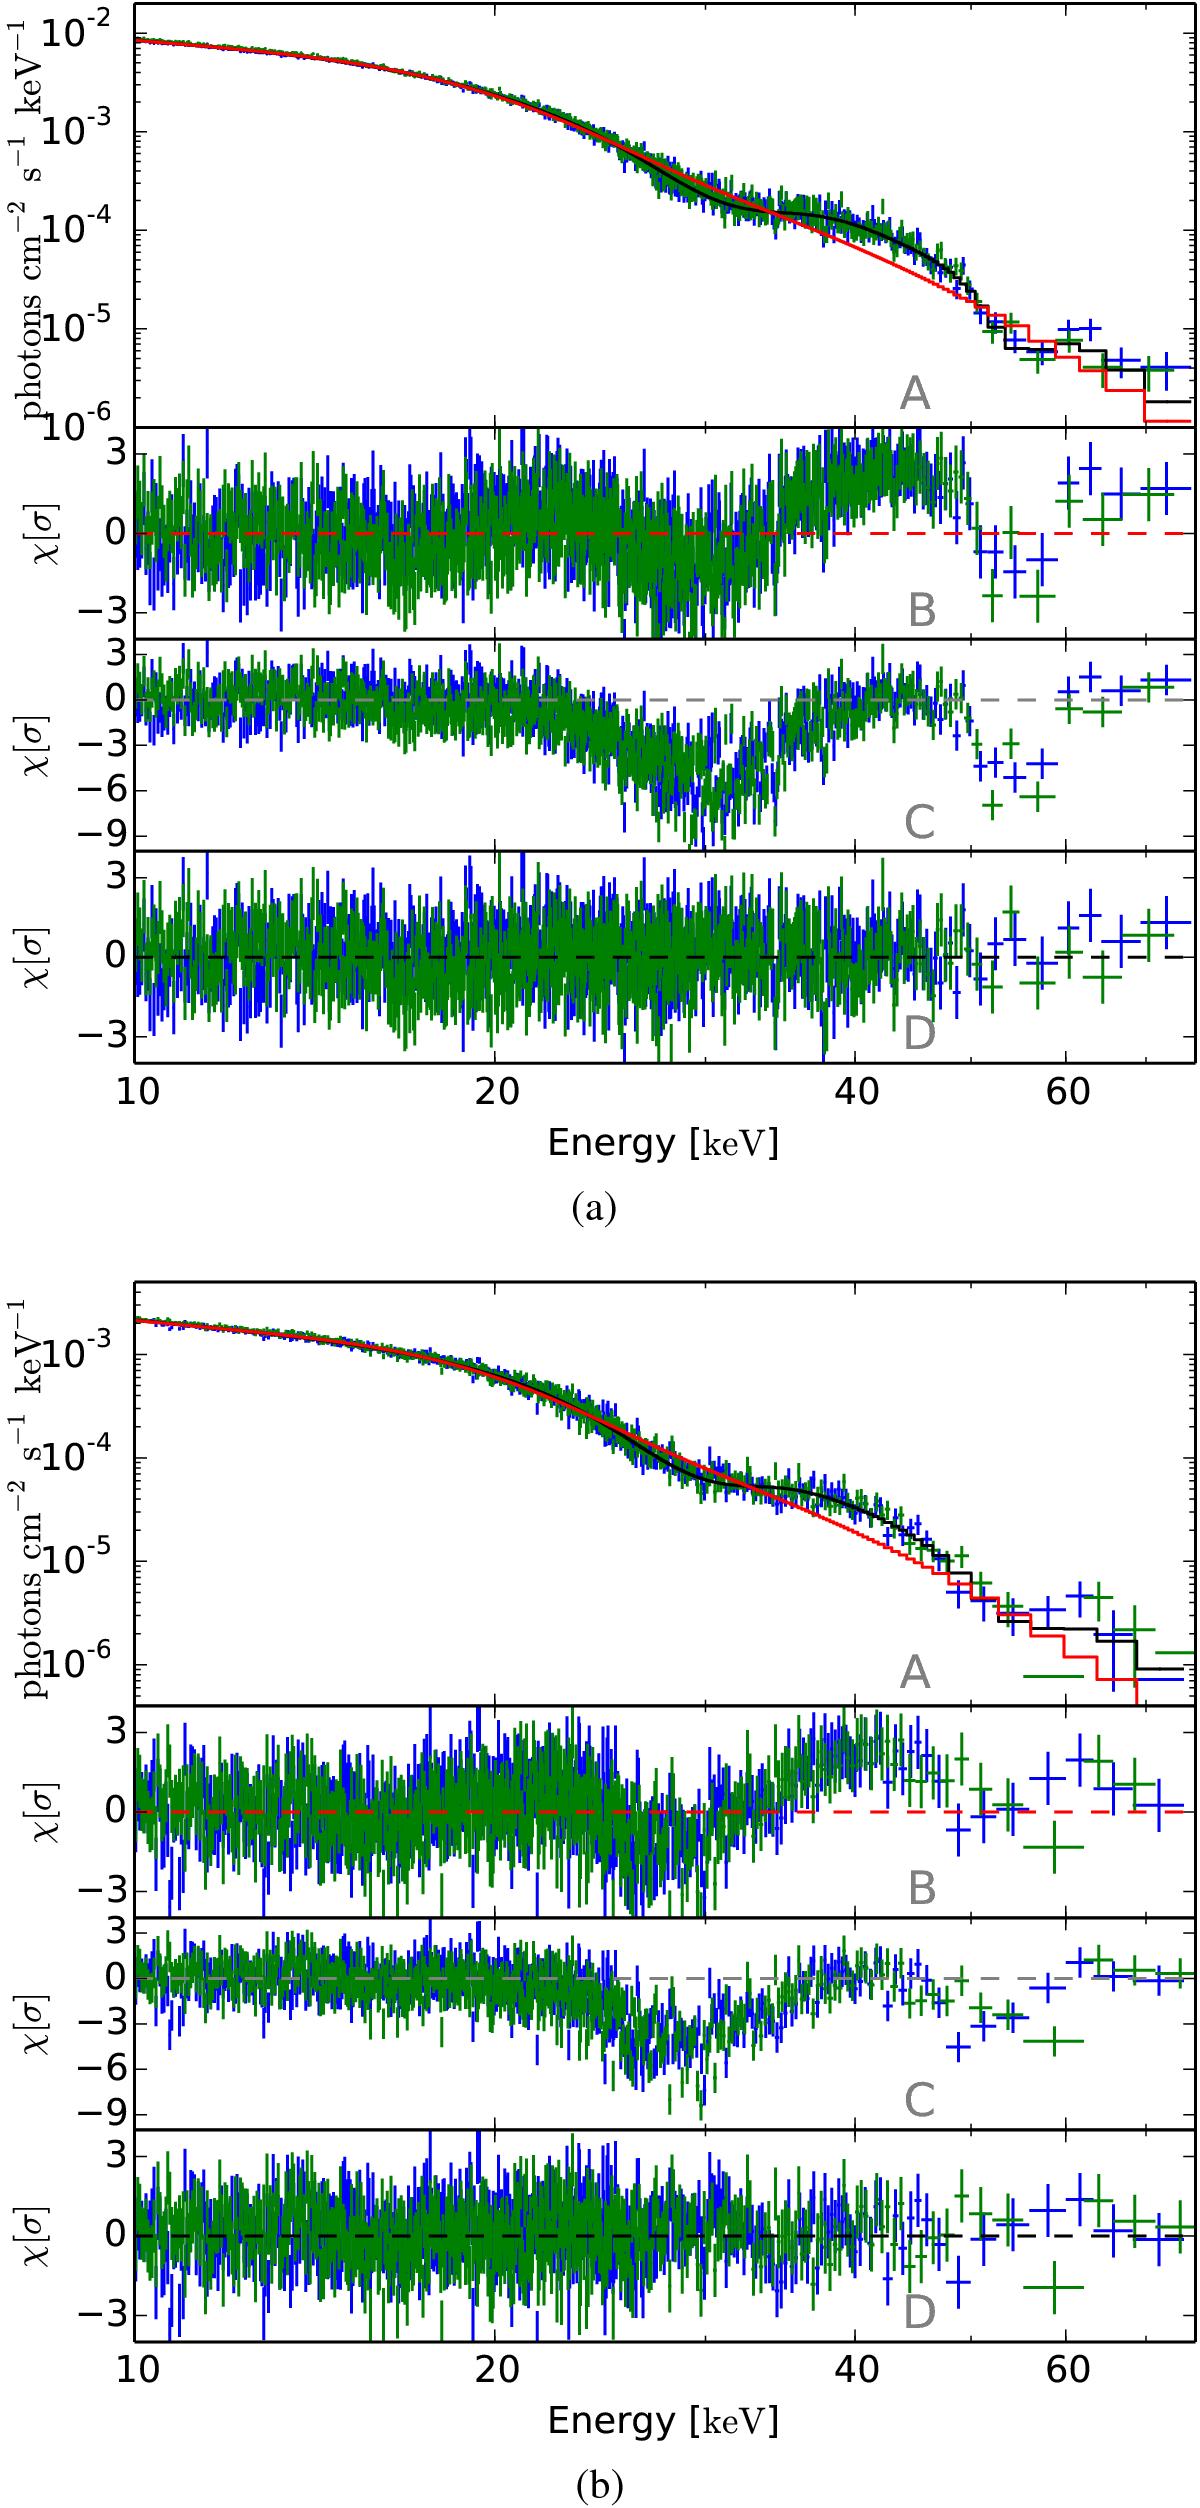
Pulse-averaged NuSTAR spectra of obs. I (a) and obs. II (b). The blue and green data points correspond to FPMA and FPMB, respectively. Panel B) shows residuals to the model without cyclotron lines (red line). Panel C) shows residuals to the model setting the strengths of the two cyclotron lines to zero, but leaving the other parameters at their best-fit values obtained using the model with the lines (in order to illustrate the contribution of the lines to the continuum). Residuals to the best-fit model (black line in panel A)) are shown in panel D). The best-fit parameters of the model with the lines are listed in Table 1.
Current usage metrics show cumulative count of Article Views (full-text article views including HTML views, PDF and ePub downloads, according to the available data) and Abstracts Views on Vision4Press platform.
Data correspond to usage on the plateform after 2015. The current usage metrics is available 48-96 hours after online publication and is updated daily on week days.
Initial download of the metrics may take a while.