Fig. 4
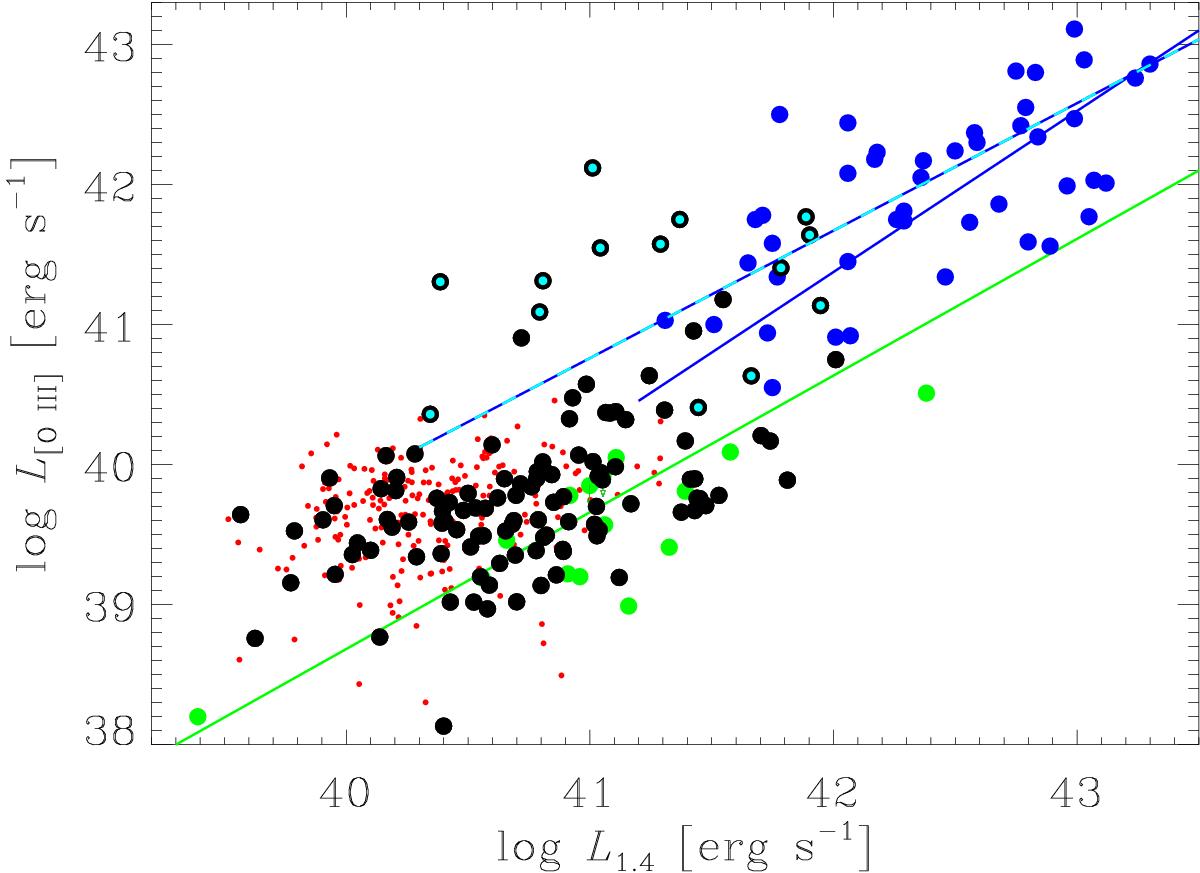
Radio (NVSS) vs. [O III] line luminosity of the FRIICAT (black), FRICAT (red), 3C-FR I (green), and 3C-FR II samples (blue) The green line (blue). shows the linear correlation between these two quantities derived from the FR Is (FR IIs) of the 3C sample from (Buttiglione et al. 2010). The dashed blue-cyan line is instead the linear fit on both the 3C and the FRIICAT HEGs.
Current usage metrics show cumulative count of Article Views (full-text article views including HTML views, PDF and ePub downloads, according to the available data) and Abstracts Views on Vision4Press platform.
Data correspond to usage on the plateform after 2015. The current usage metrics is available 48-96 hours after online publication and is updated daily on week days.
Initial download of the metrics may take a while.