Fig. 2
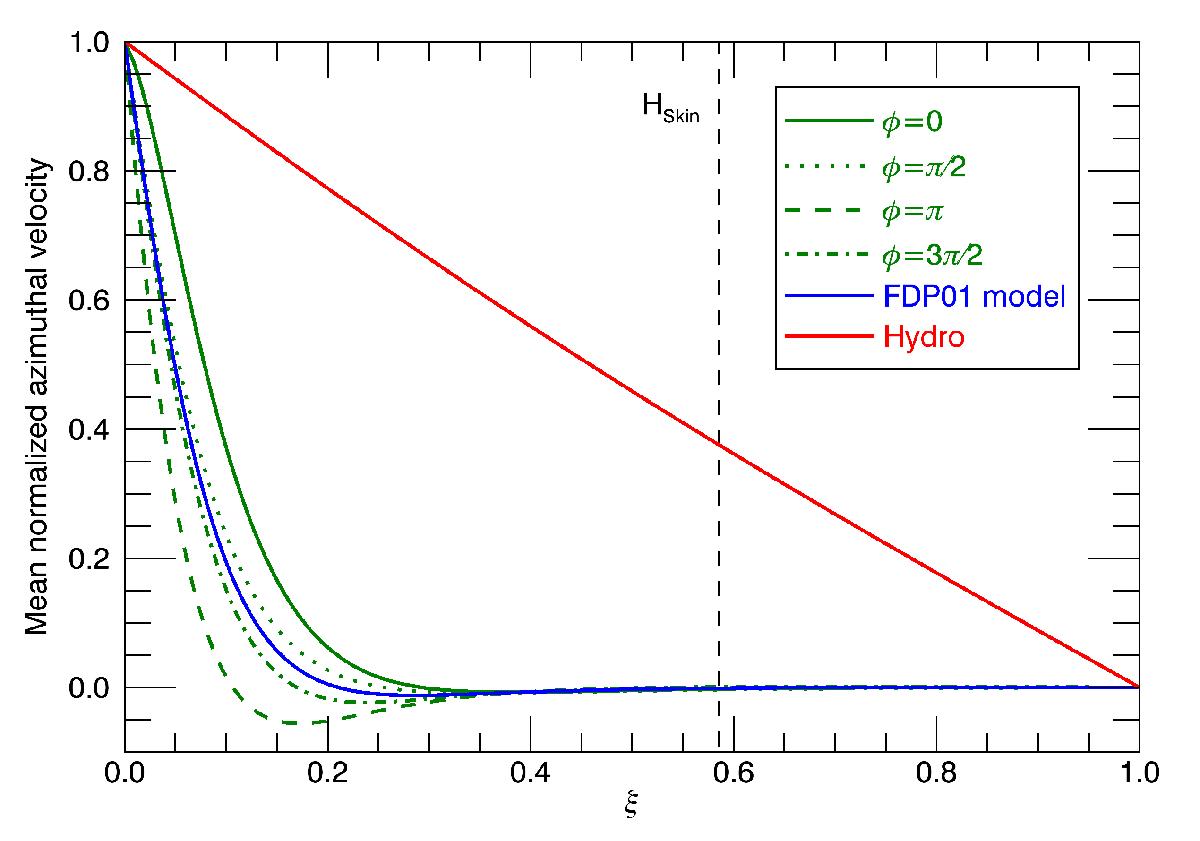
Normalized azimuthal velocity averaged over one cycle as a function of depth. The red line corresponds to an hydrodynamical viscous steady state without magnetic field. The blue curve shows results with the toroidal component set to zero at the top of the tachocline, as in FDP01. The green lines are cases with oscillating poloidal and toroidal magnetic fields, with different phase lags. Corresponding model parameter values are listed in Table 1.
Current usage metrics show cumulative count of Article Views (full-text article views including HTML views, PDF and ePub downloads, according to the available data) and Abstracts Views on Vision4Press platform.
Data correspond to usage on the plateform after 2015. The current usage metrics is available 48-96 hours after online publication and is updated daily on week days.
Initial download of the metrics may take a while.