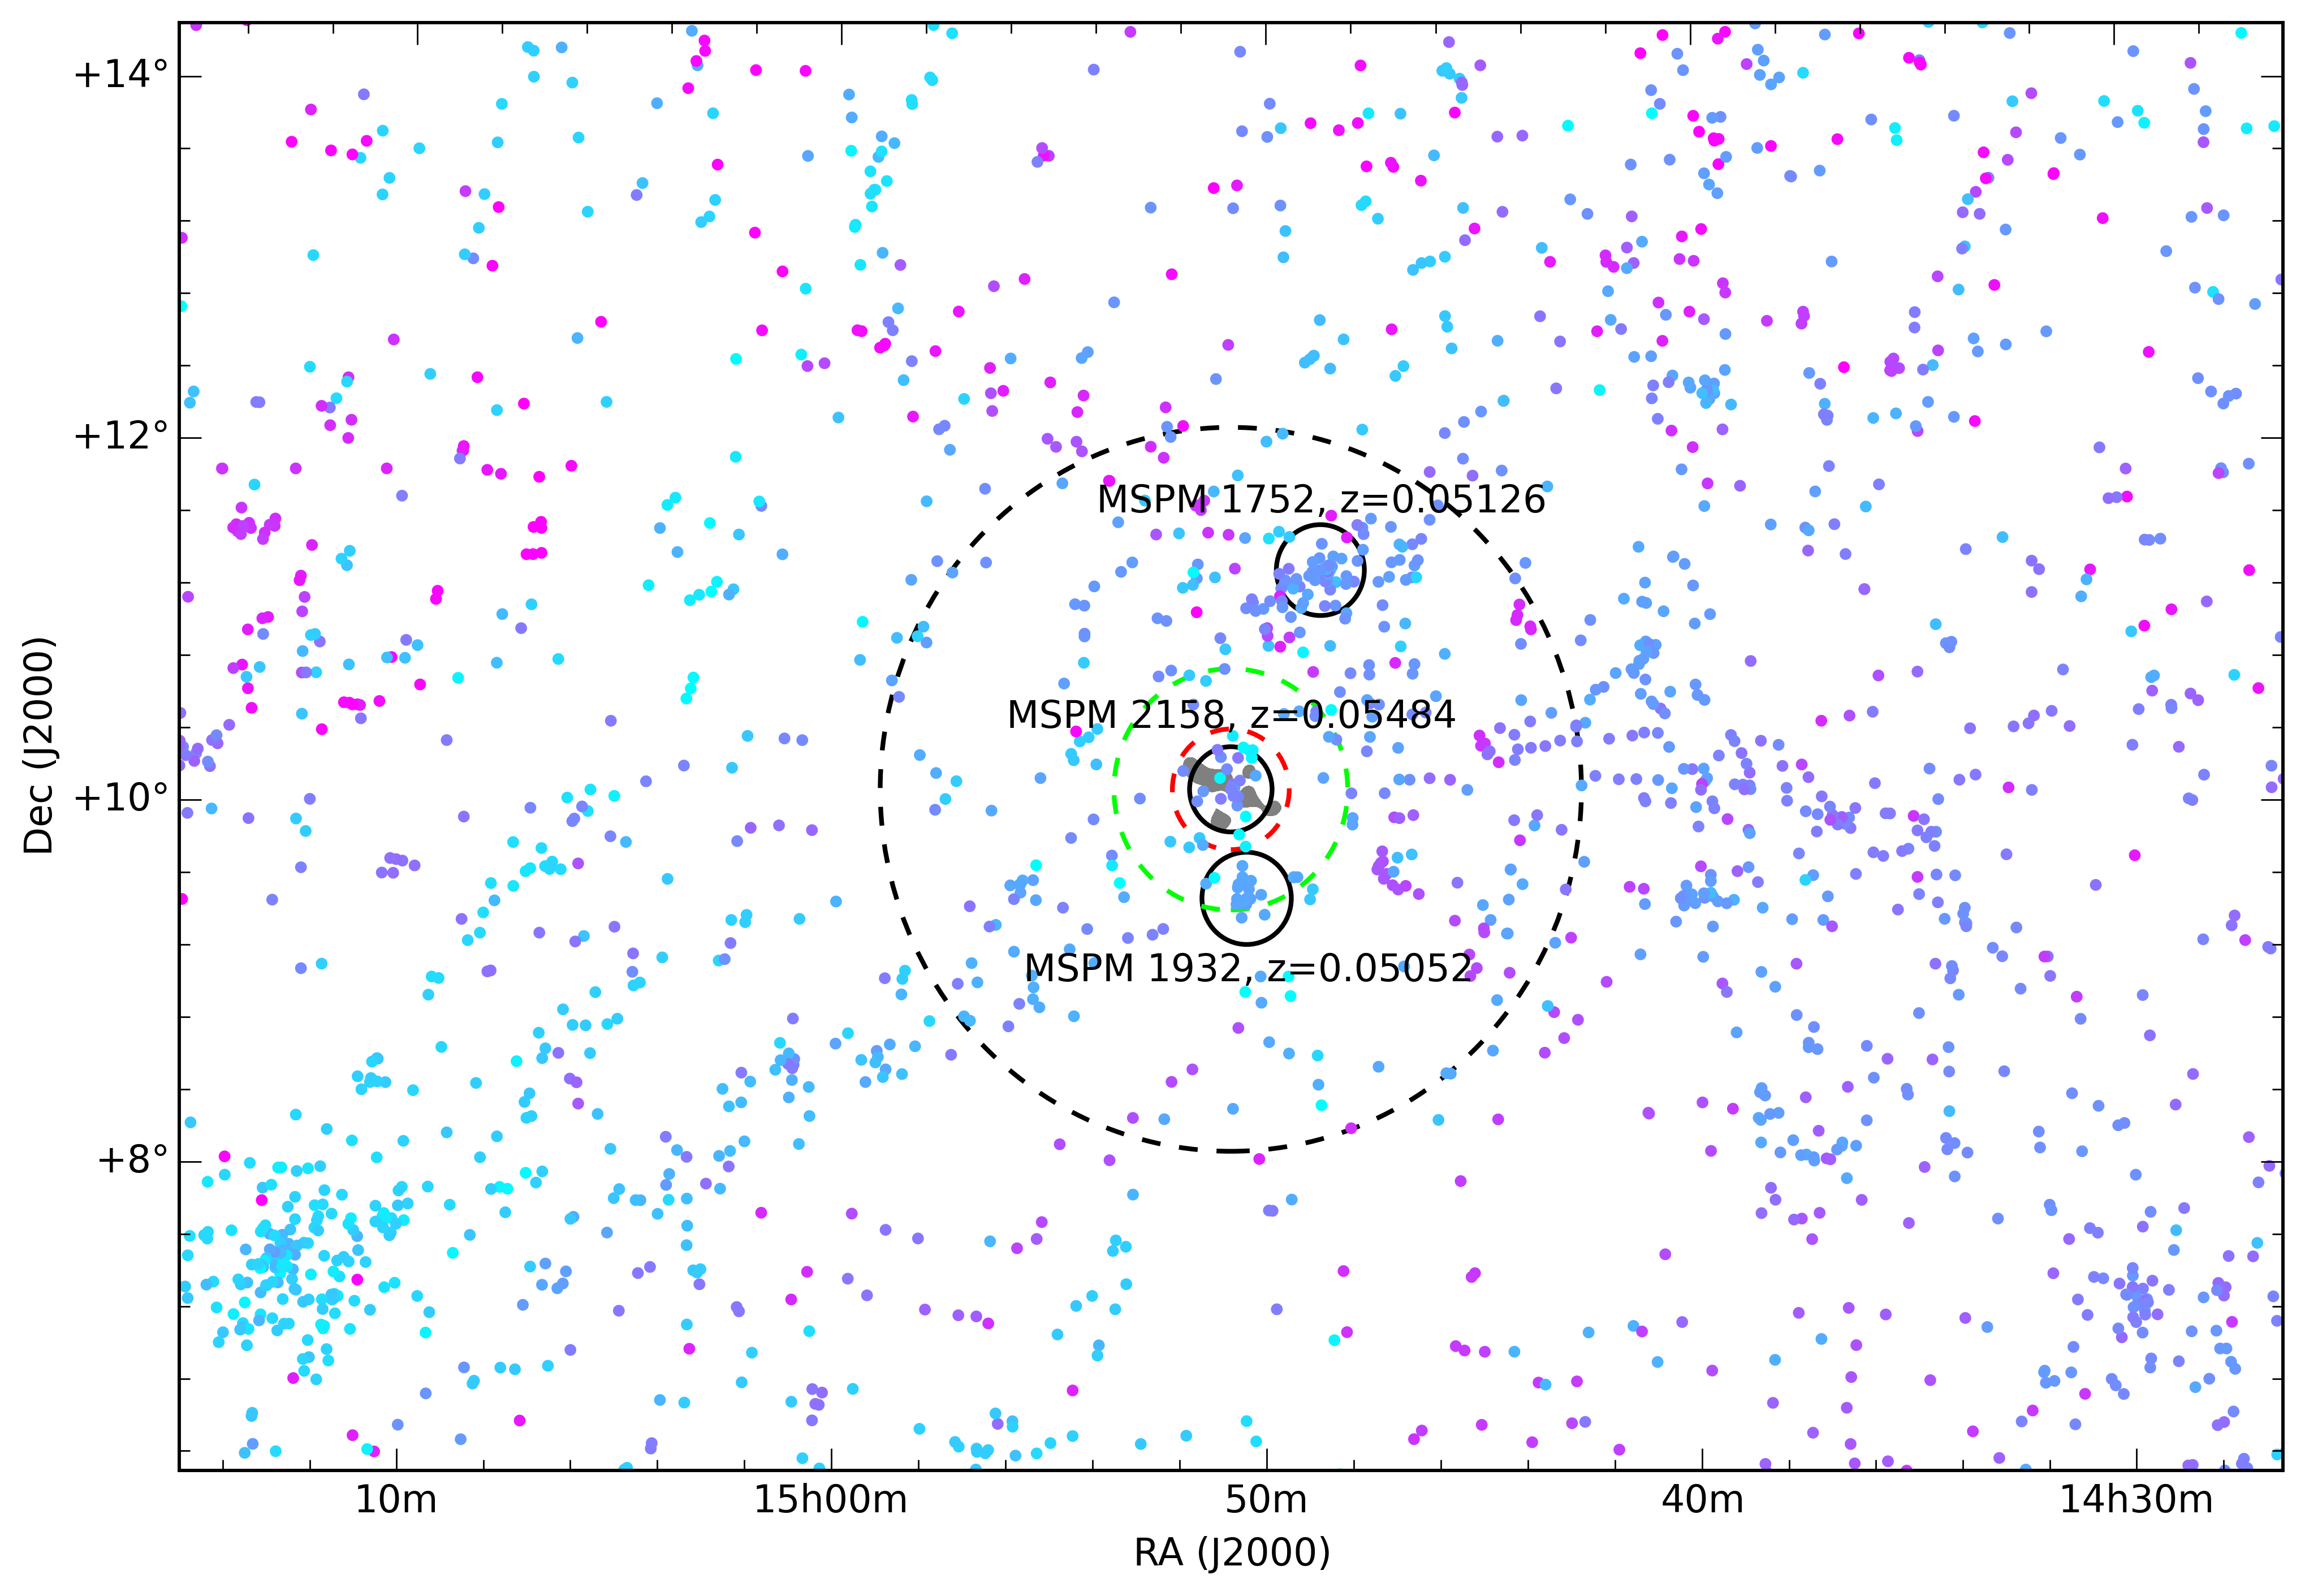
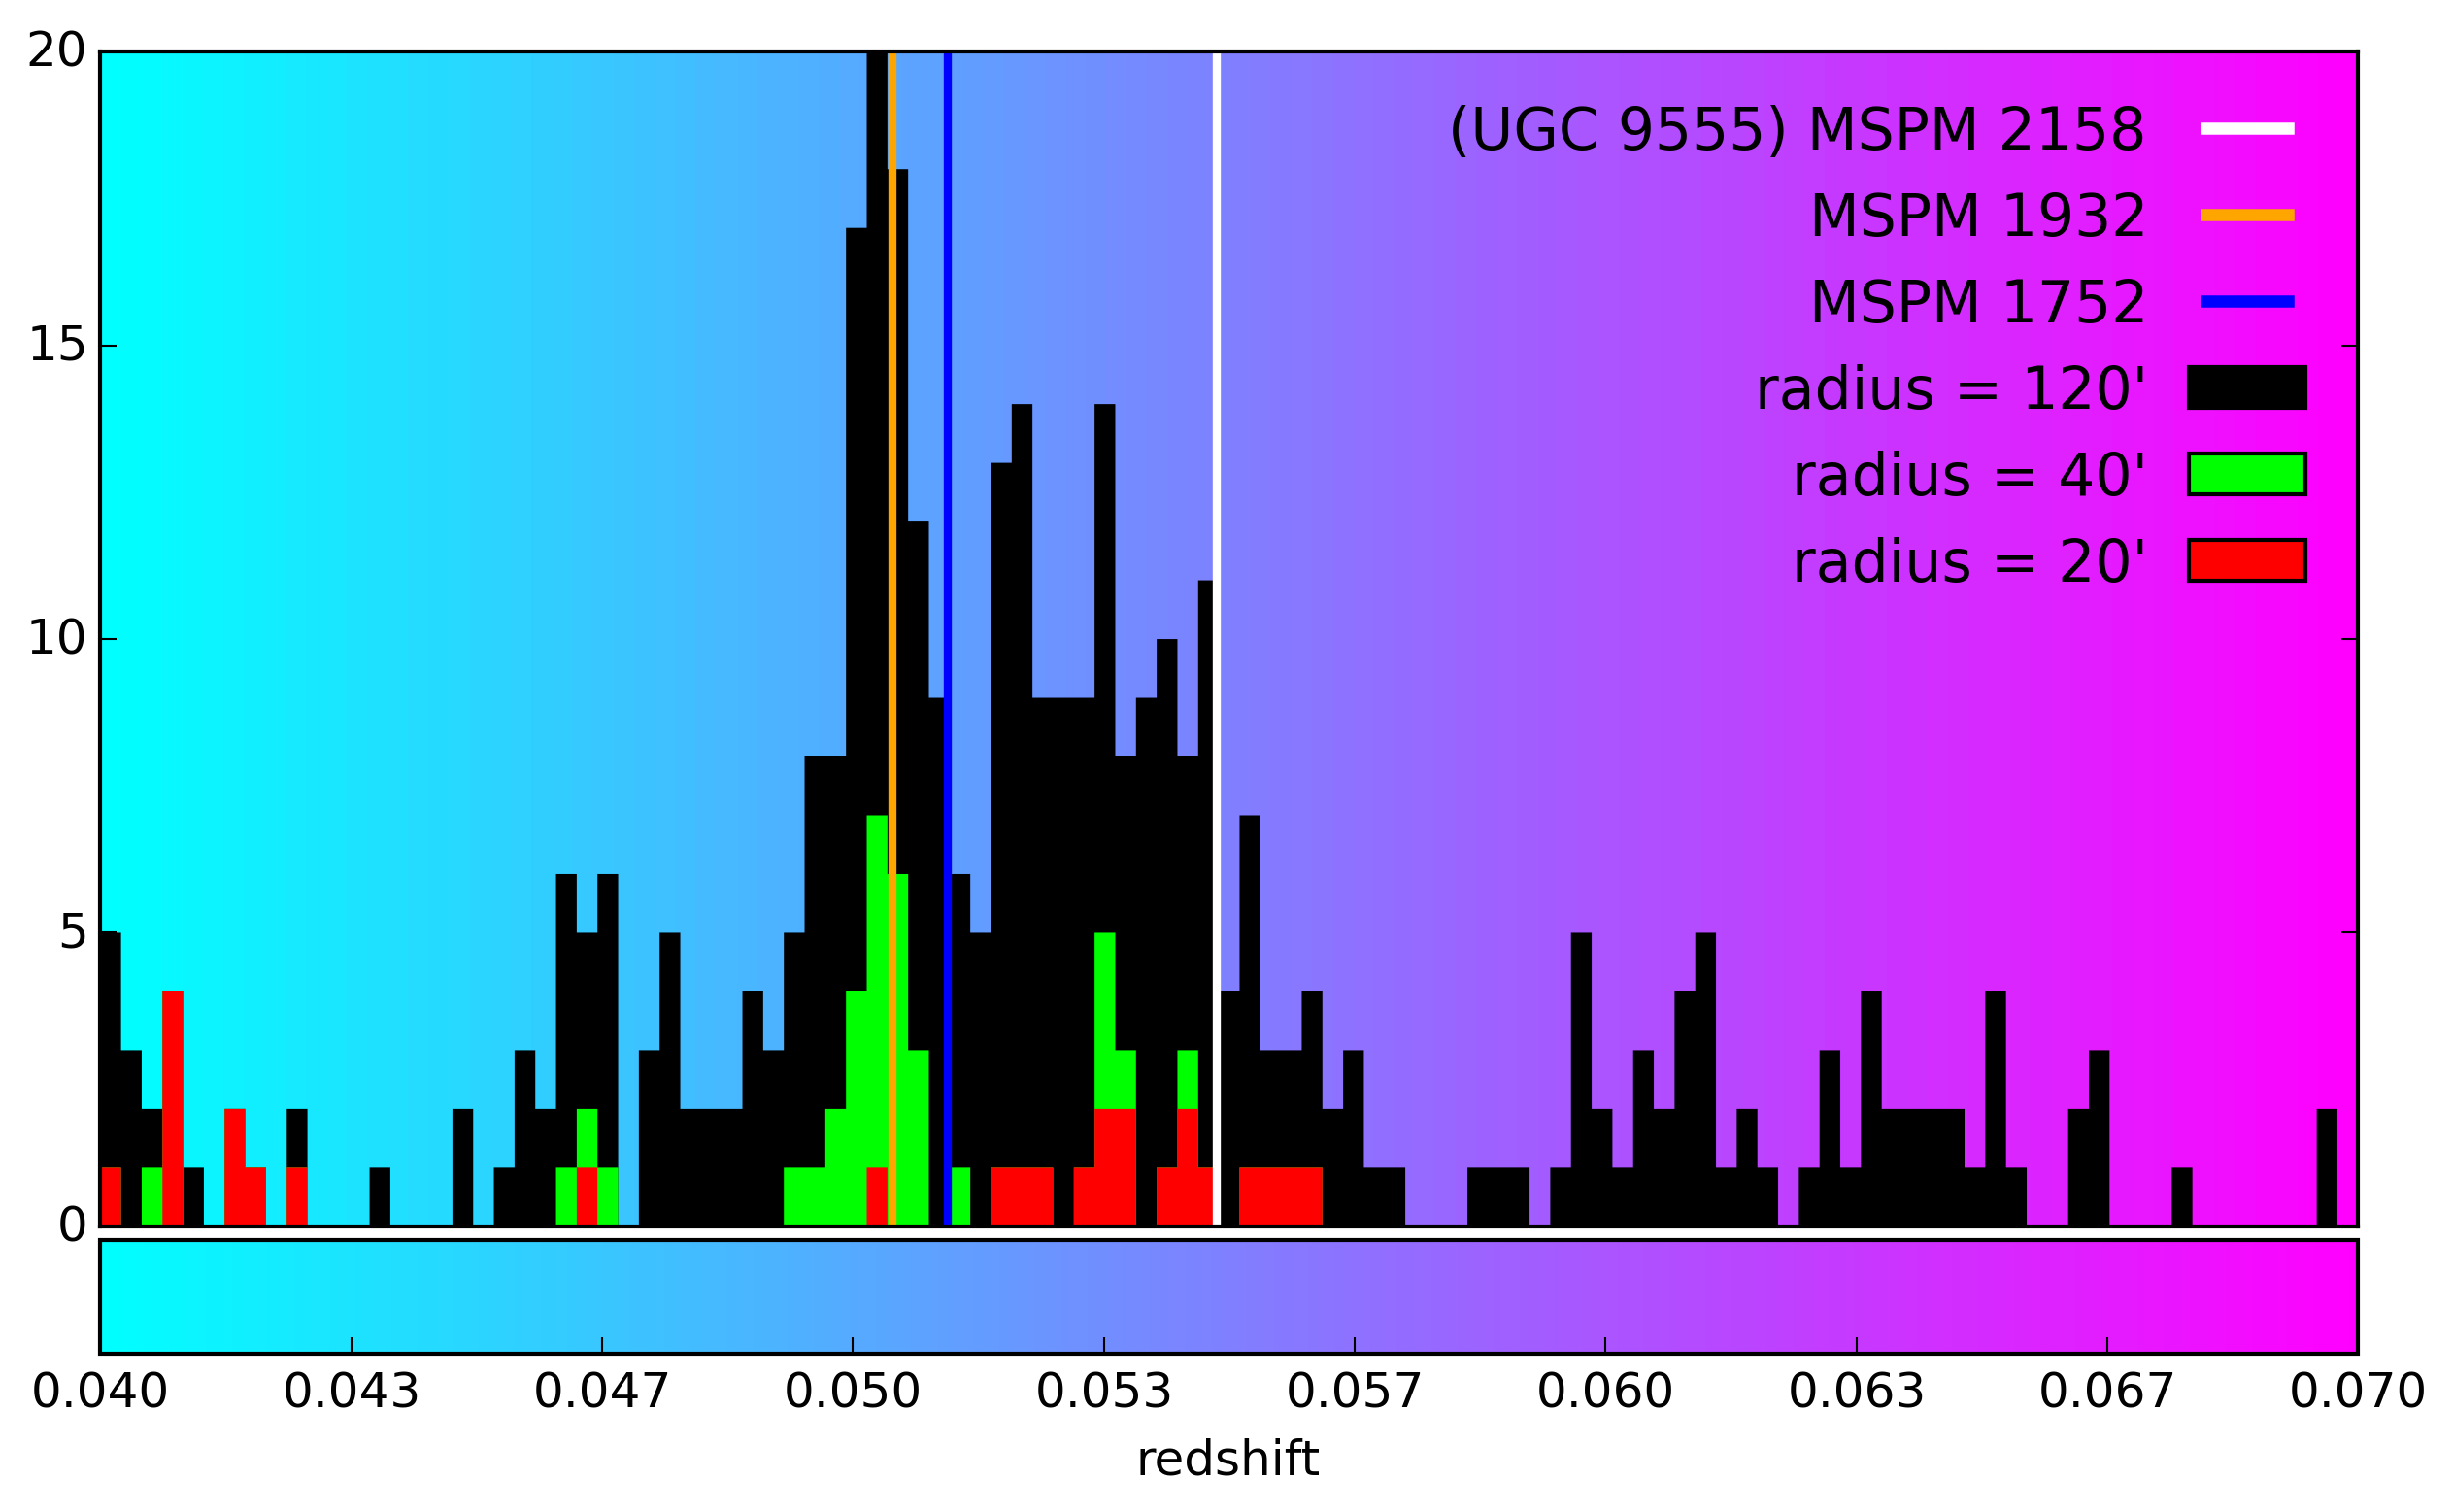
Fig. 3
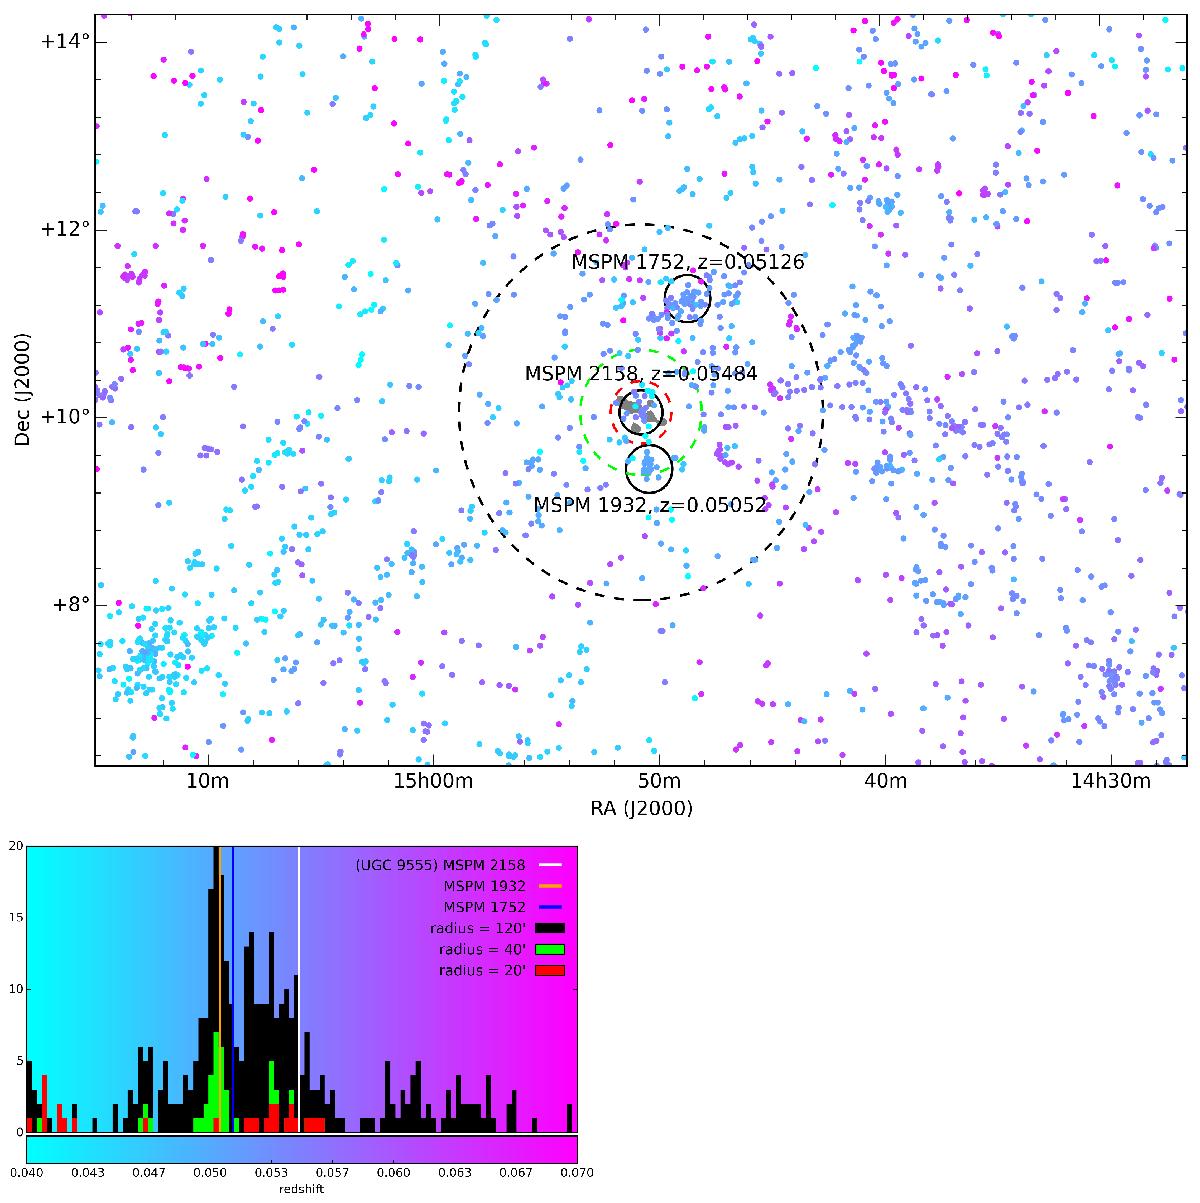
Top: large-scale galaxy distribution is shown, where filled circles coloured by redshift are galaxies identified with spectroscopic redshifts in SDSS DR12. Black circles of 1 Mpc radius (at their respective redshifts) are centred on the closest three galaxy groups in the region identified by multiscale probability mapping analysis. The grey-shaded area in MSPM 2158 shows the extent of the GRG. For a detailed view of the inner region around the GRG, see Fig. 1. Dashed circles in black, green and red are overlaid to show the areas included in the histogram to theleft. Left: a histogram of the redshifts of galaxies in SDSS Data Release 12 within several radii around the host AGN, as illustrated in the top panel.
Current usage metrics show cumulative count of Article Views (full-text article views including HTML views, PDF and ePub downloads, according to the available data) and Abstracts Views on Vision4Press platform.
Data correspond to usage on the plateform after 2015. The current usage metrics is available 48-96 hours after online publication and is updated daily on week days.
Initial download of the metrics may take a while.