Fig. 6
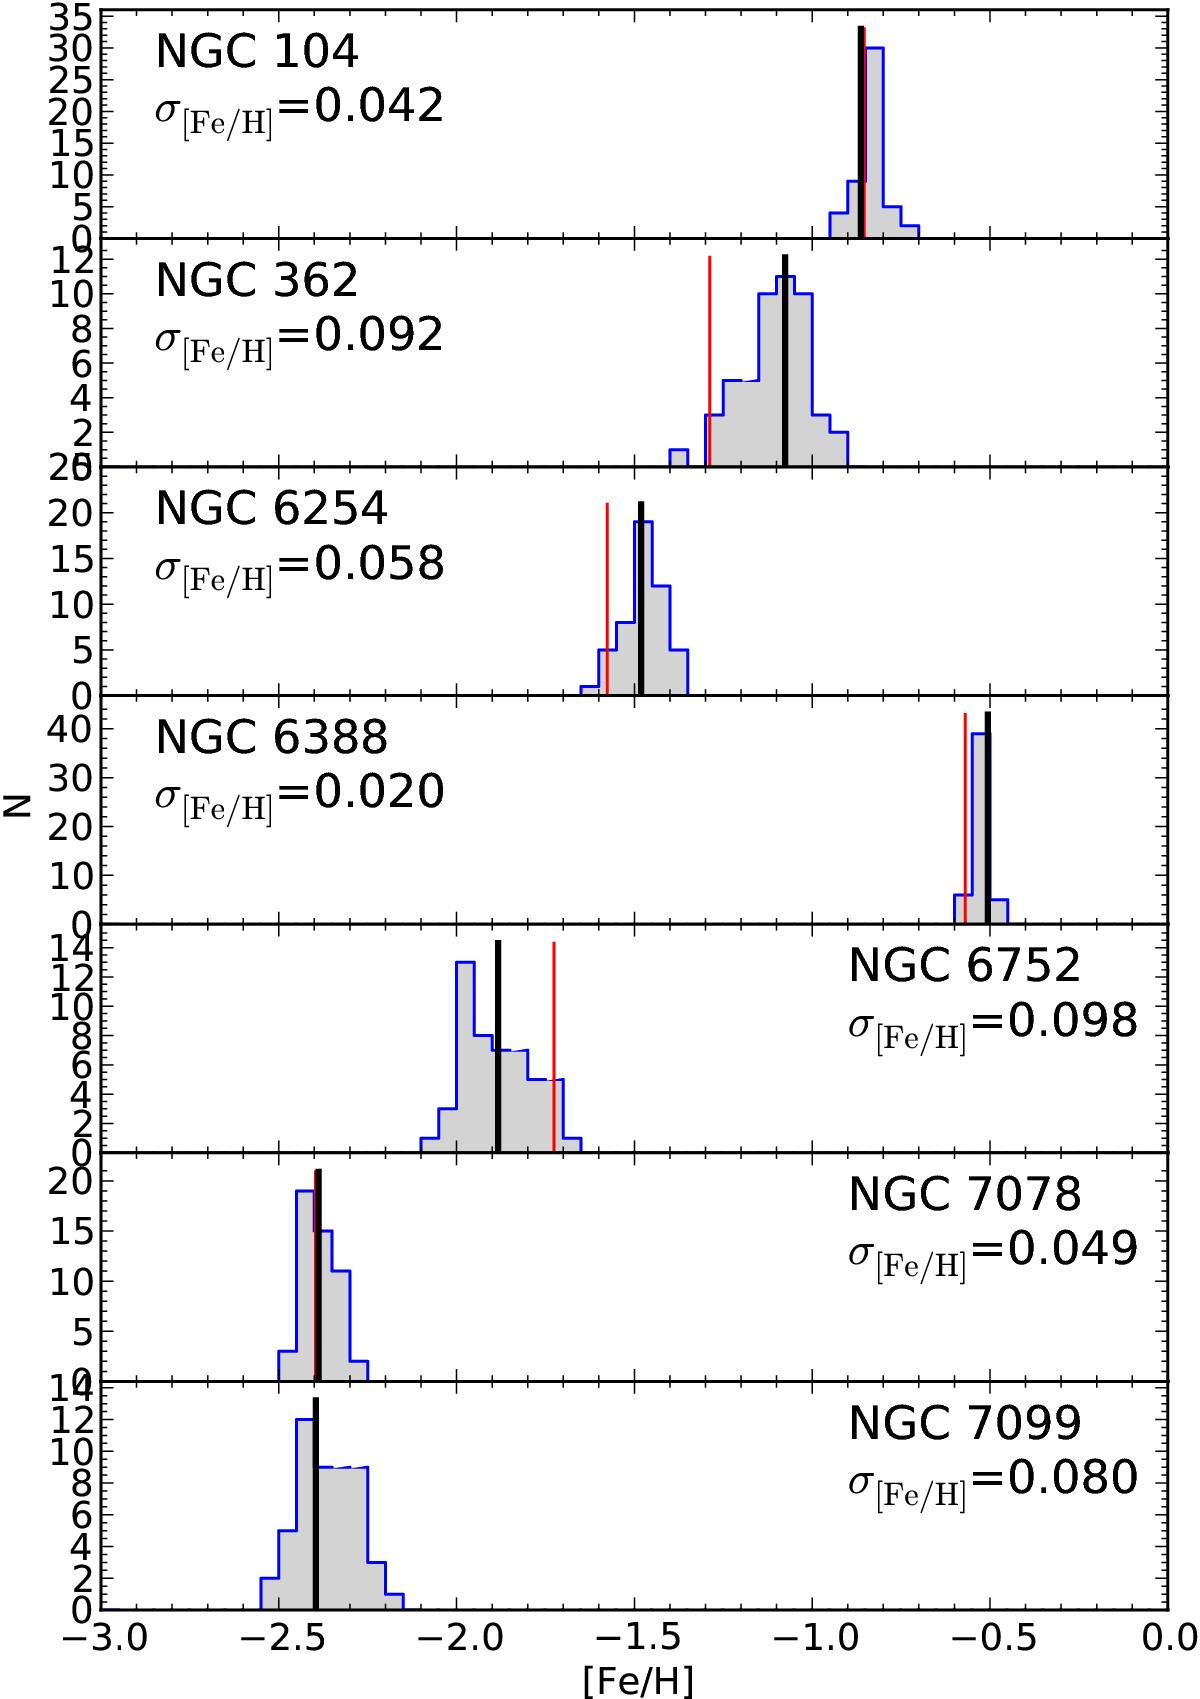
Distributions of Fe abundances for 50 random sub-samples of the cluster CMDs. Each subsample contains a similar number of stars to the areas covered by the slit scans. Vertical thin (red) lines: Fe abundances based on stars located approximately within the slit scan areas. Vertical thick (black) lines: Fe abundances based on all stars.
Current usage metrics show cumulative count of Article Views (full-text article views including HTML views, PDF and ePub downloads, according to the available data) and Abstracts Views on Vision4Press platform.
Data correspond to usage on the plateform after 2015. The current usage metrics is available 48-96 hours after online publication and is updated daily on week days.
Initial download of the metrics may take a while.