Fig. 4
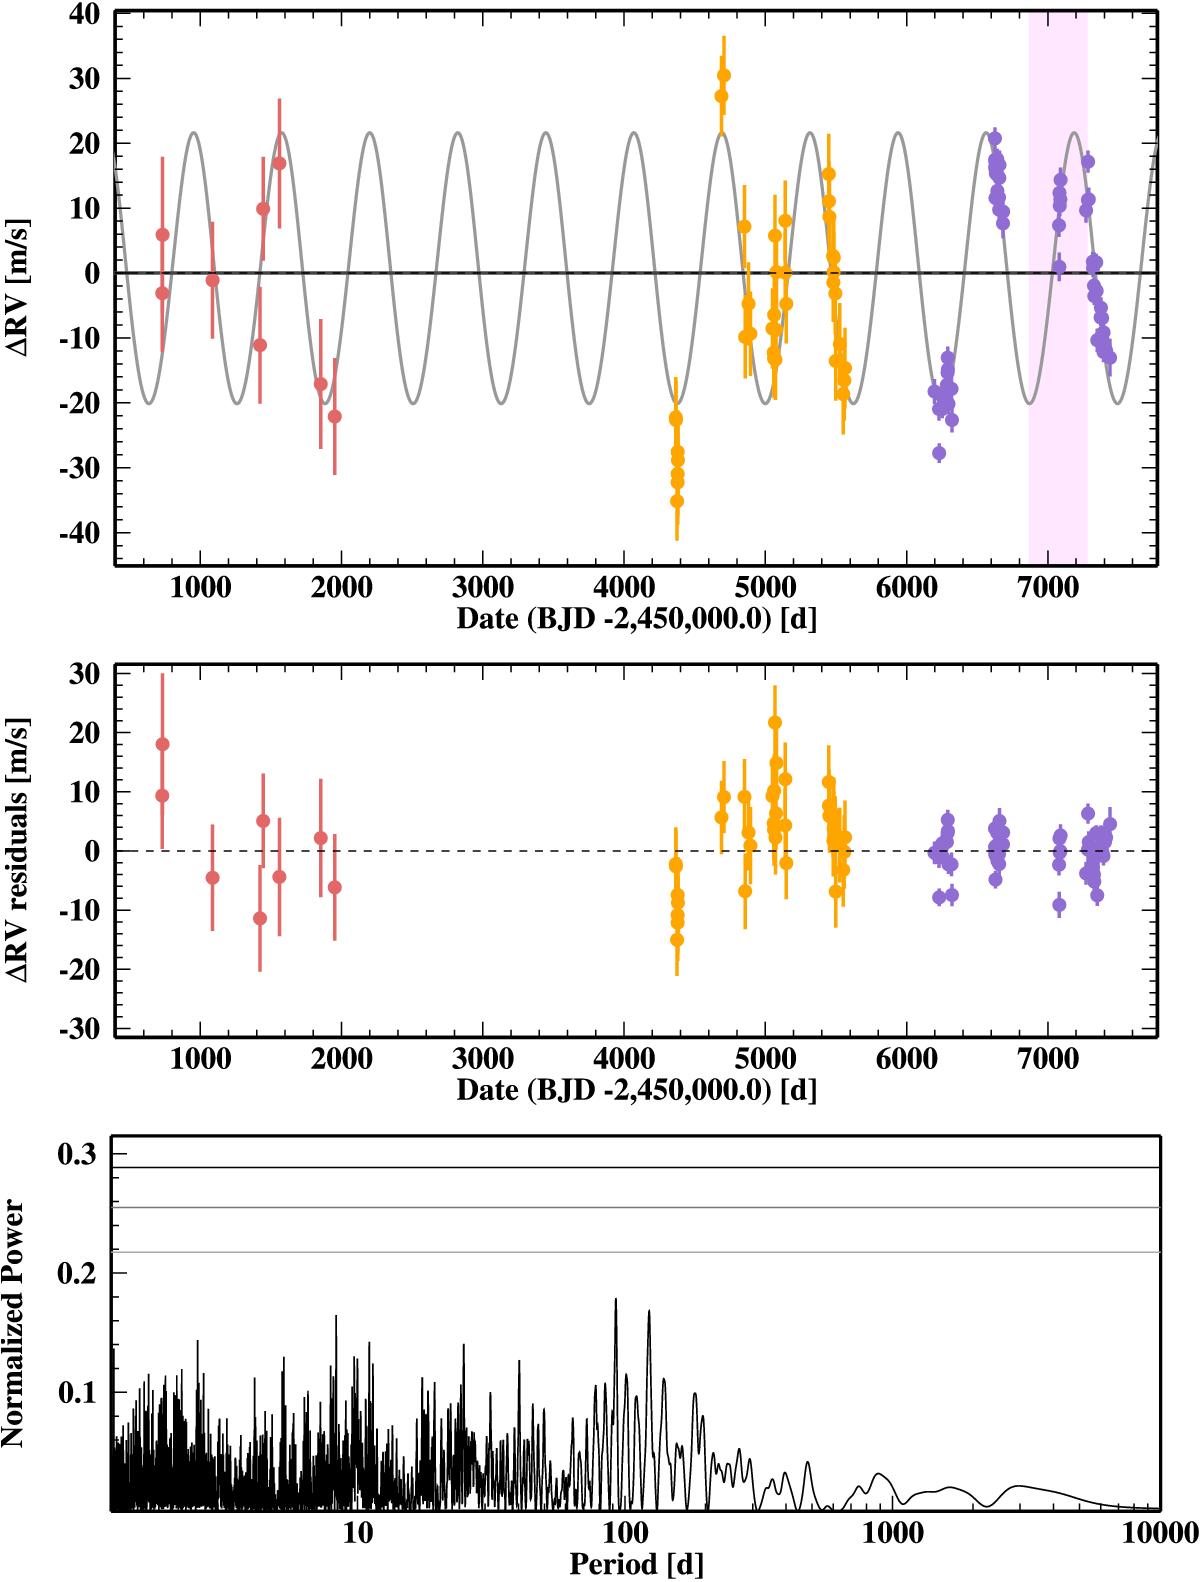
Radial velocity curve (top) and residuals (middle) of HD 17674. ELODIE data shown in red, SOPHIE in orange, and SOPHIE+ in purple. The region in pink indicates the Gaia observation dates for DR1. Generalized Lomb-Scargle (GLS) periodogram (bottom) of the radial velocities after subtraction of the planetary orbit. False alarm probability lines are plotted for 50%, 10%, and 1%.
Current usage metrics show cumulative count of Article Views (full-text article views including HTML views, PDF and ePub downloads, according to the available data) and Abstracts Views on Vision4Press platform.
Data correspond to usage on the plateform after 2015. The current usage metrics is available 48-96 hours after online publication and is updated daily on week days.
Initial download of the metrics may take a while.