Fig. 3
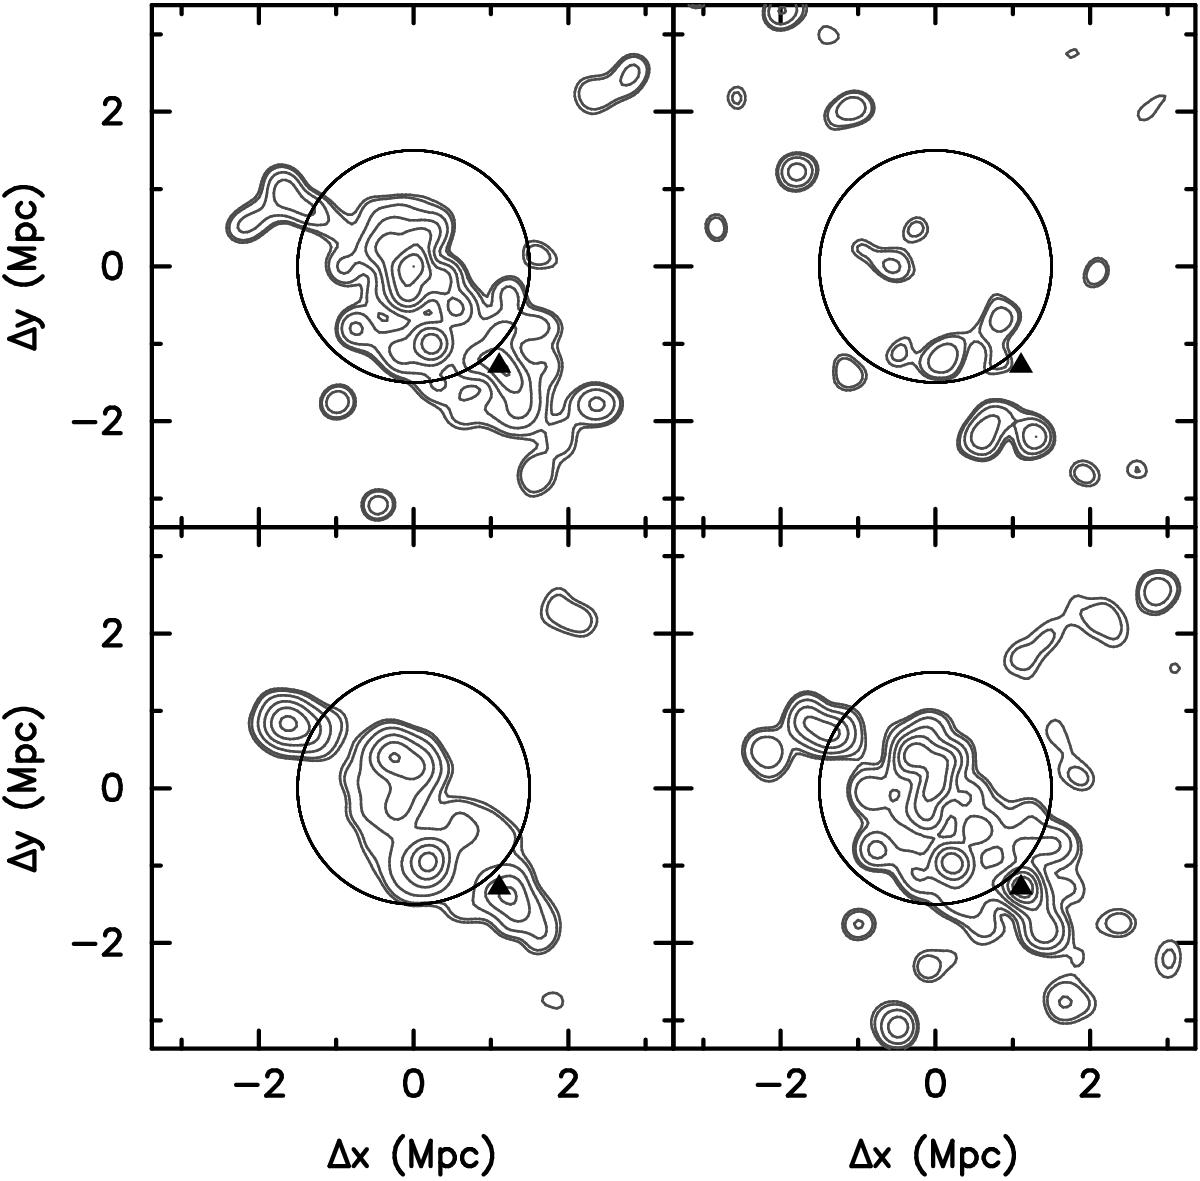
Galaxy surface density maps for the red (top left), blue (top right), and bright red (bottom left) galaxy populations of RXC J0225. The bottom right panel shows the luminosity density map for the red galaxies. In each panel, the triangle marks the position of the central BCG. The circle has a radius of 1.5 Mpc, and is centred on the highest density peak of red galaxies. Contours start at 5(3)σ for the red (blue) galaxies, and follow a square-root scale.
Current usage metrics show cumulative count of Article Views (full-text article views including HTML views, PDF and ePub downloads, according to the available data) and Abstracts Views on Vision4Press platform.
Data correspond to usage on the plateform after 2015. The current usage metrics is available 48-96 hours after online publication and is updated daily on week days.
Initial download of the metrics may take a while.