Fig. 4
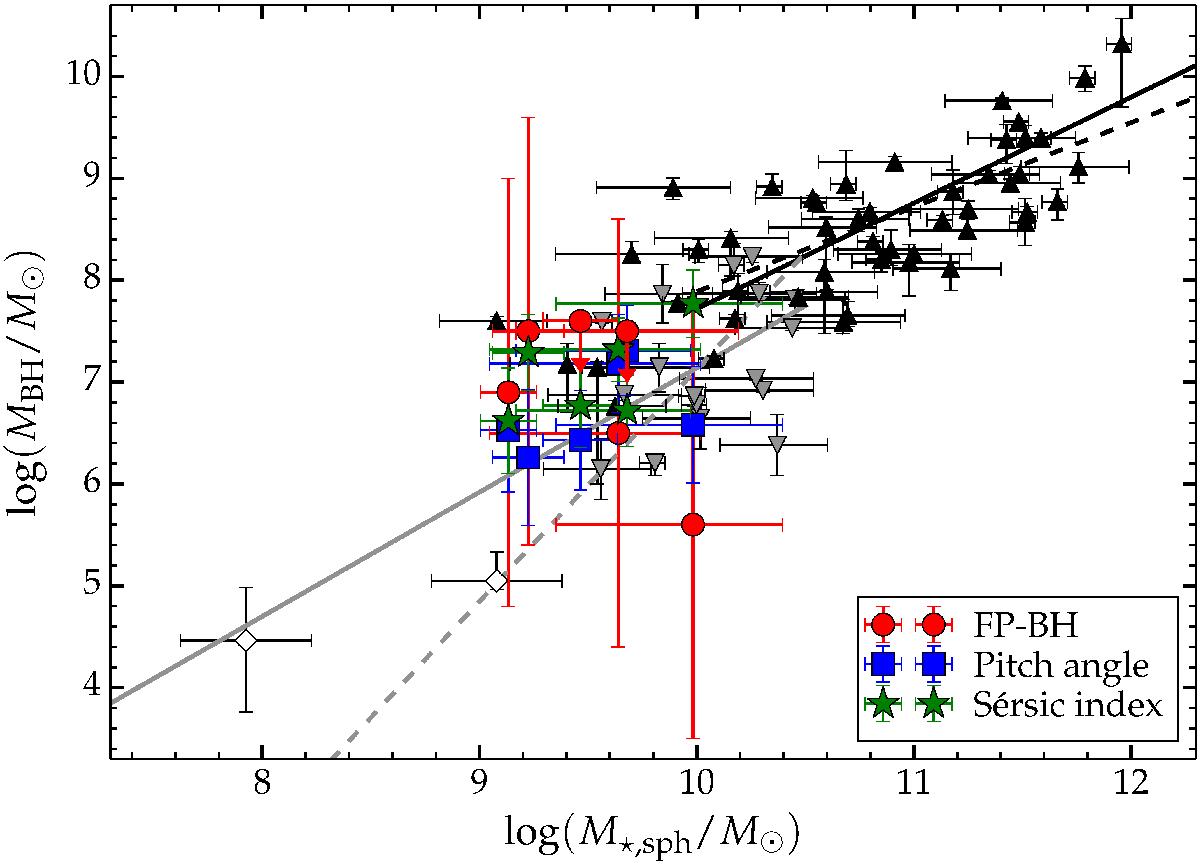
Mass estimates of the central BH of seven LLAGN (colored points), using our multiple method approach vs. spheroid stellar mass (M⋆ sph). Our plot points have been plotted on top of the scaling relations from Savorgnan et al. (2016) (solid lines: Y on X-axis regression, dashed lines: symmetric regression), the data that the authors used to obtain them as triangles with error bars (black/gray for ellipticals/spirals), the empty diamonds are two other IMBH candidates (LEDA87300: e.g., Baldassare et al. 2015; Graham et al. 2016 and Pox52: e.g., Barth et al. 2004; Thornton et al. 2008; Ciambur 2016), and the colored data points are our results. The green stars come from the Sérsic index, the blue squares from pitch angle and the red circles from the FP-BH. The BH masses derived from the bulge luminosity were not plotted, so as not to overcrowd the plot and since the spheroid luminosity (Lsph) is more or less directly related to the spheroid stellar mass (M⋆ sph) via the mass-to-light ratio.
Current usage metrics show cumulative count of Article Views (full-text article views including HTML views, PDF and ePub downloads, according to the available data) and Abstracts Views on Vision4Press platform.
Data correspond to usage on the plateform after 2015. The current usage metrics is available 48-96 hours after online publication and is updated daily on week days.
Initial download of the metrics may take a while.