Fig. 2
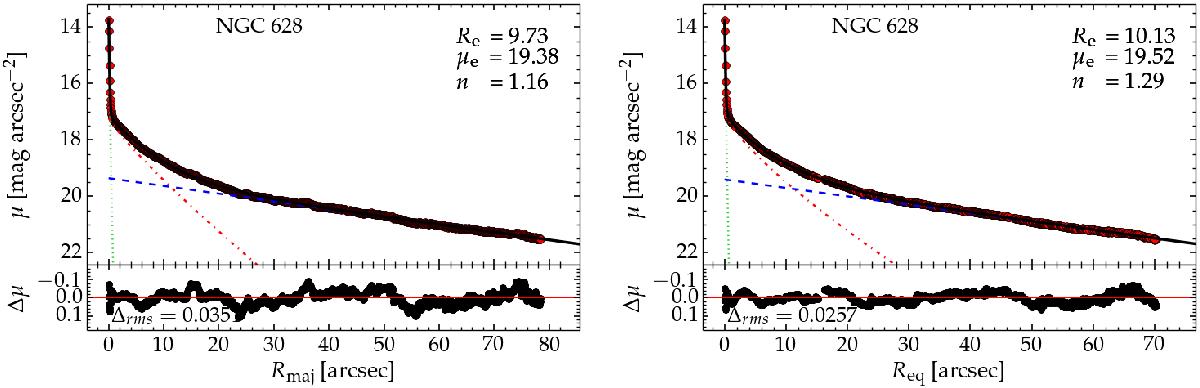
Top panels: decomposed surface brightness profile of NGC 628 along the major (left) and equivalent (right) axis. The data is represented as red circles while the model is the black curve. This galaxy has a central point source (green, dotted line), a Sérsic spheroid (red, dash-dotted line) and an exponential disc (blue, dashed line). Inset in the upper left are the best-fit spheroid parameters. Below the decomposition panels are the residual (Δμ) profiles.
Current usage metrics show cumulative count of Article Views (full-text article views including HTML views, PDF and ePub downloads, according to the available data) and Abstracts Views on Vision4Press platform.
Data correspond to usage on the plateform after 2015. The current usage metrics is available 48-96 hours after online publication and is updated daily on week days.
Initial download of the metrics may take a while.