Fig. 4
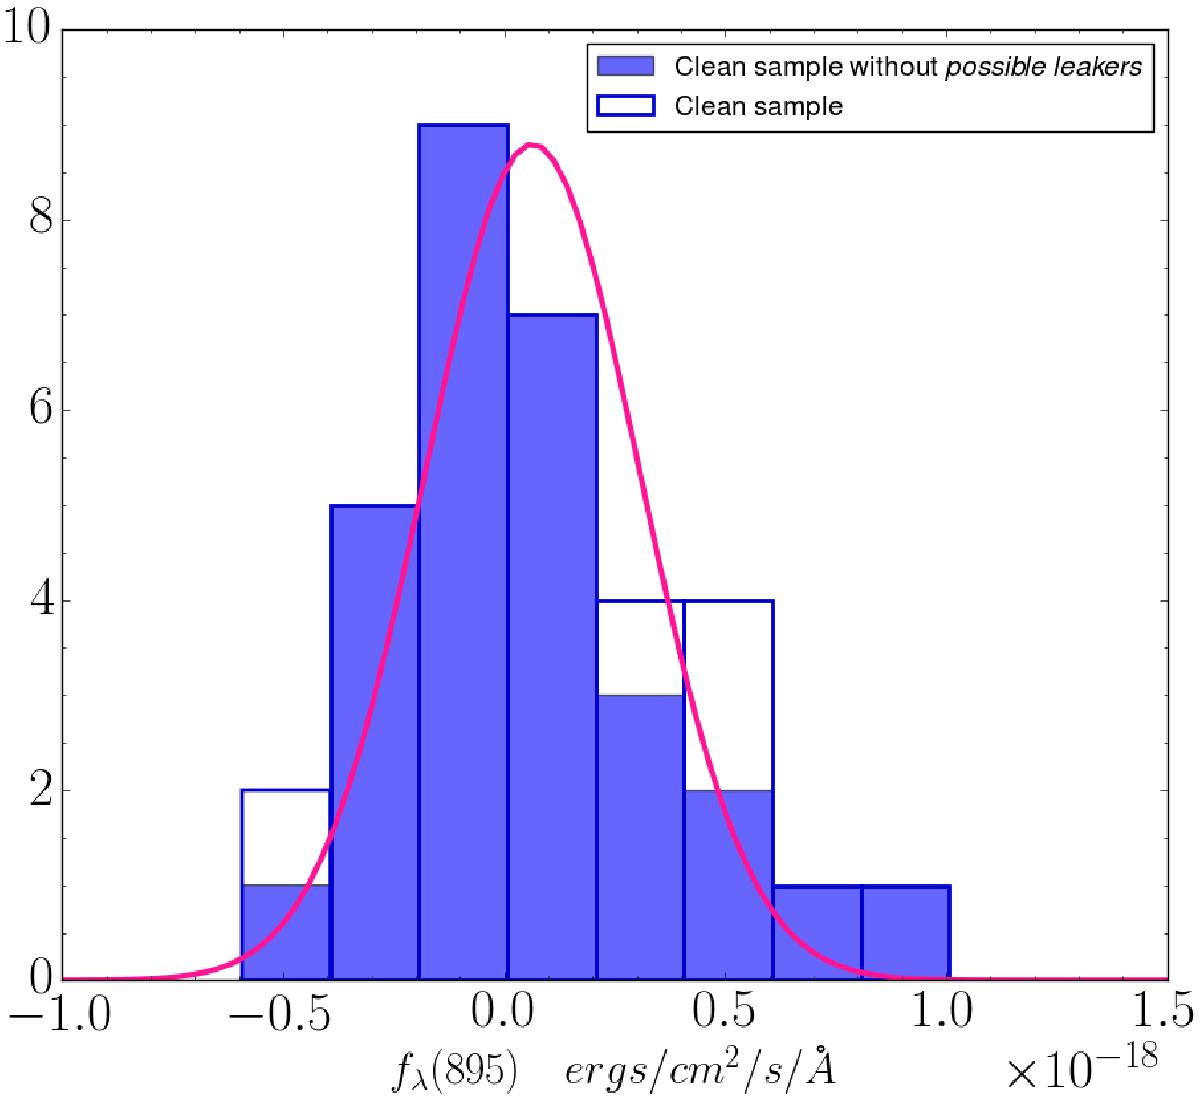
Distribution of the fluxes measured as the mean fluxes in the LyC range of each spectrum (880−910 Å) for the sources that have LyC flux within three times their standard deviation (filled histogram) and for the clean sample (empty histogram). The Gaussian fit of the distribution without the possible leakers is shown in magenta.
Current usage metrics show cumulative count of Article Views (full-text article views including HTML views, PDF and ePub downloads, according to the available data) and Abstracts Views on Vision4Press platform.
Data correspond to usage on the plateform after 2015. The current usage metrics is available 48-96 hours after online publication and is updated daily on week days.
Initial download of the metrics may take a while.