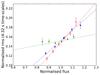
Fig. 1
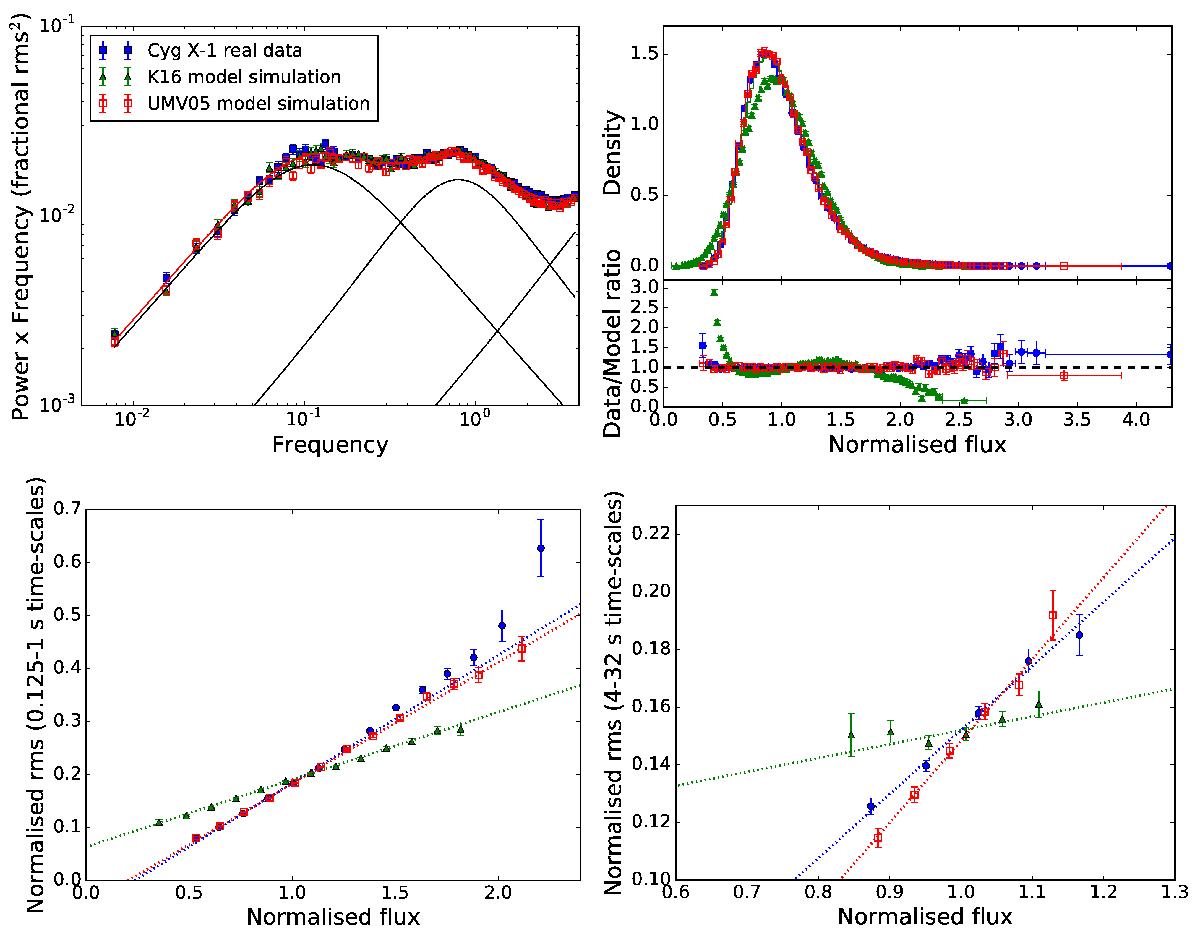
Comparison of real Cyg X-1 hard state data (blue circles) with simulated data showing the same power spectrum, made using the K16 model (green triangles) or the “exponentiated” model of UMV05 (open red squares). Top left: power spectra of the light curves, including the best-fitting Lorentzian decomposition for the real data (black lines, total model line in solid red). Top right: flux distributions (flux normalised by mean count rate), models (coloured lines) and data/model ratios for a fit to a lognormal model with constant offset constrained to be non-negative. Bottom panels: the rms-flux relations of the light curves obtained for rms measured on two different time-scale ranges, short (0.125−1 s, bottom left panel) and long (4−32 s, bottom right panel). Best-fitting linear (plus constant) relations are also shown as dotted lines. For the flux distributions and rms-flux relations, the K16 model is strongly inconsistent with the data, while the UMV05 model works reasonably well.
Current usage metrics show cumulative count of Article Views (full-text article views including HTML views, PDF and ePub downloads, according to the available data) and Abstracts Views on Vision4Press platform.
Data correspond to usage on the plateform after 2015. The current usage metrics is available 48-96 hours after online publication and is updated daily on week days.
Initial download of the metrics may take a while.