Fig. 8
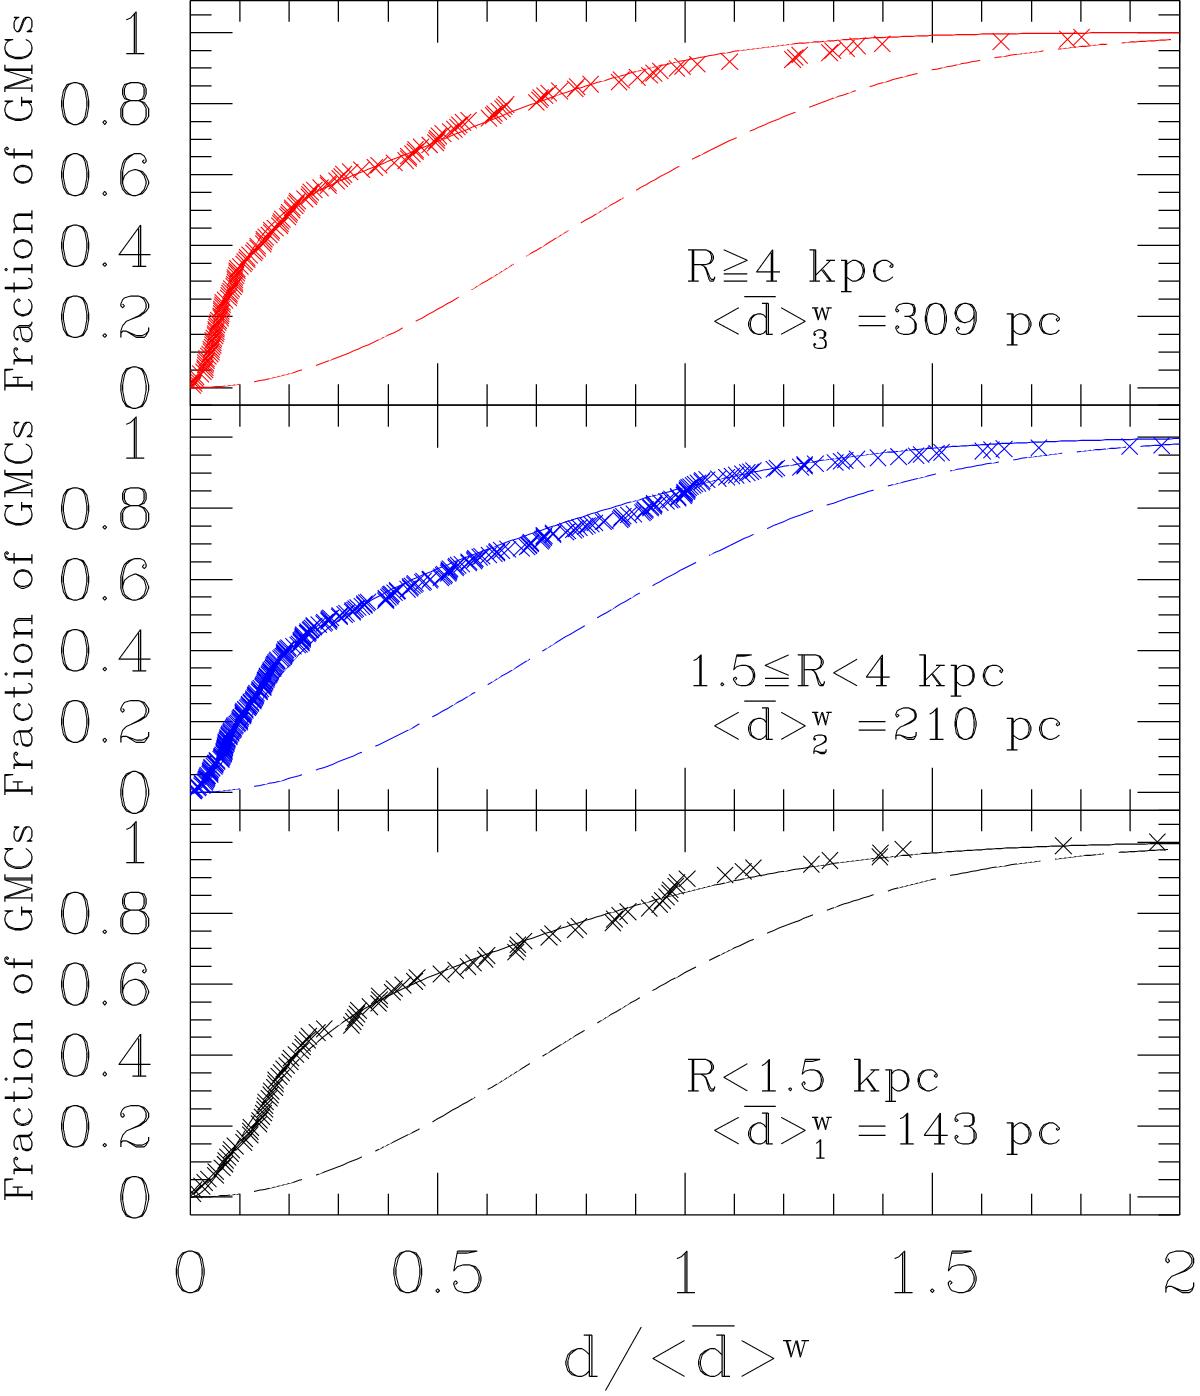
Positional correlation of GMCs with YSCCs for the three selected radial ranges in the M 33 disk as a function of ![]() . The innermost and central regions have a quite similar positional correlation function when the distances are scaled with
. The innermost and central regions have a quite similar positional correlation function when the distances are scaled with ![]() . The continuous lines are the fits, with our model accounting for a correlation, while the dashed curves represent the expectation in the absence of a correlation.
. The continuous lines are the fits, with our model accounting for a correlation, while the dashed curves represent the expectation in the absence of a correlation.
Current usage metrics show cumulative count of Article Views (full-text article views including HTML views, PDF and ePub downloads, according to the available data) and Abstracts Views on Vision4Press platform.
Data correspond to usage on the plateform after 2015. The current usage metrics is available 48-96 hours after online publication and is updated daily on week days.
Initial download of the metrics may take a while.