Fig. 7
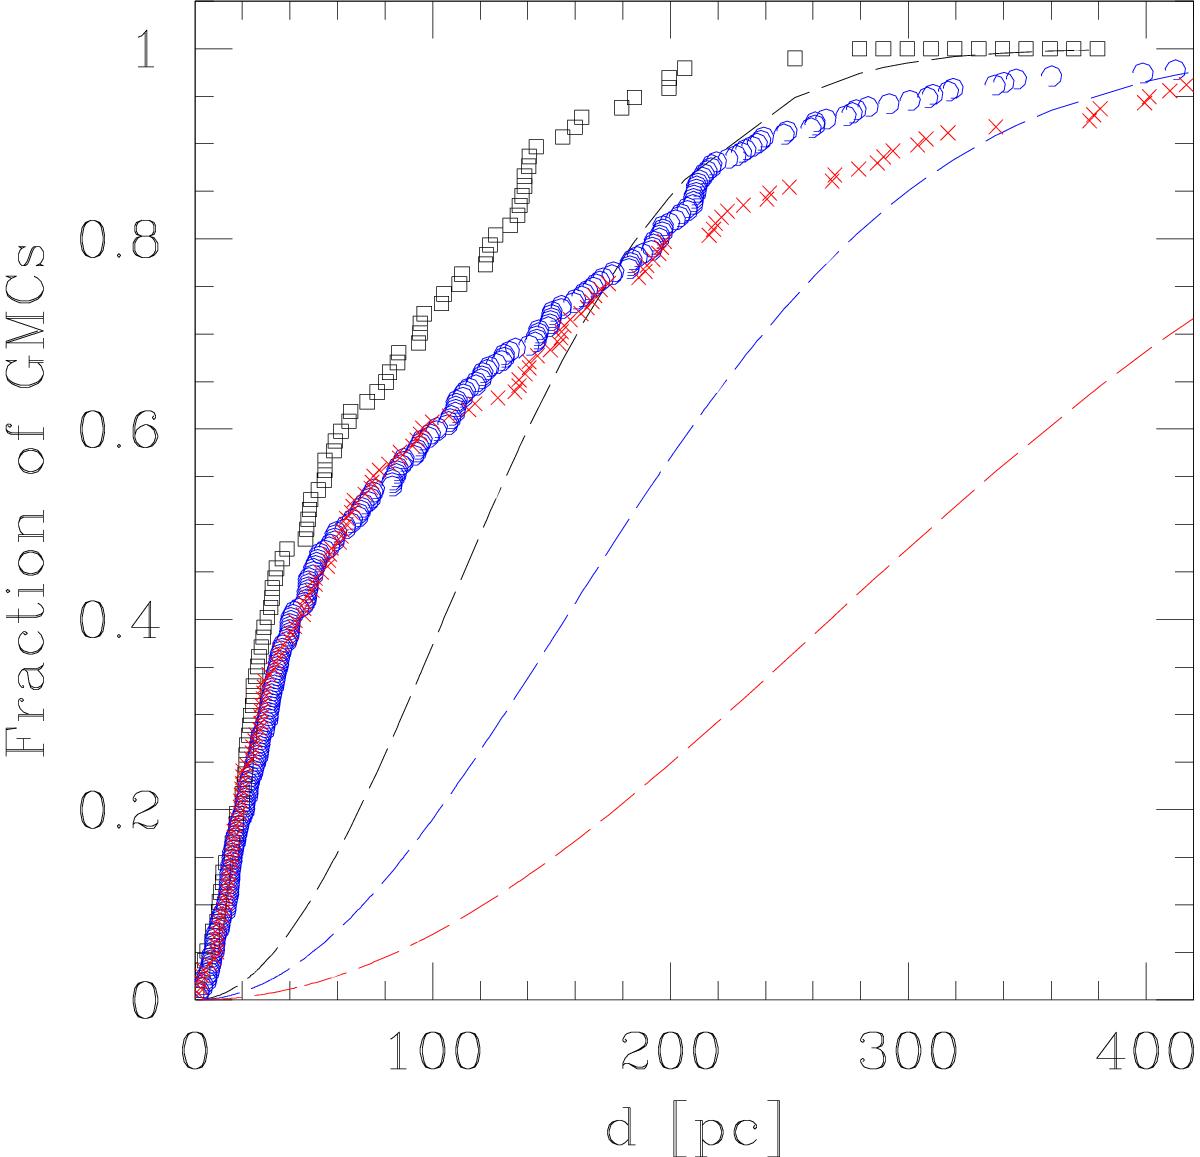
Positional correlation of GMCs with YSCCs. We show the fraction of GMCs with at least one YSCC at a separation d, given in pc, using black squares for the inner region, open blue circles for the middle region, and red crosses for the outer region. The dashed lines are the fractions expected for a random association. A significant clustering is found.
Current usage metrics show cumulative count of Article Views (full-text article views including HTML views, PDF and ePub downloads, according to the available data) and Abstracts Views on Vision4Press platform.
Data correspond to usage on the plateform after 2015. The current usage metrics is available 48-96 hours after online publication and is updated daily on week days.
Initial download of the metrics may take a while.