Fig. 4
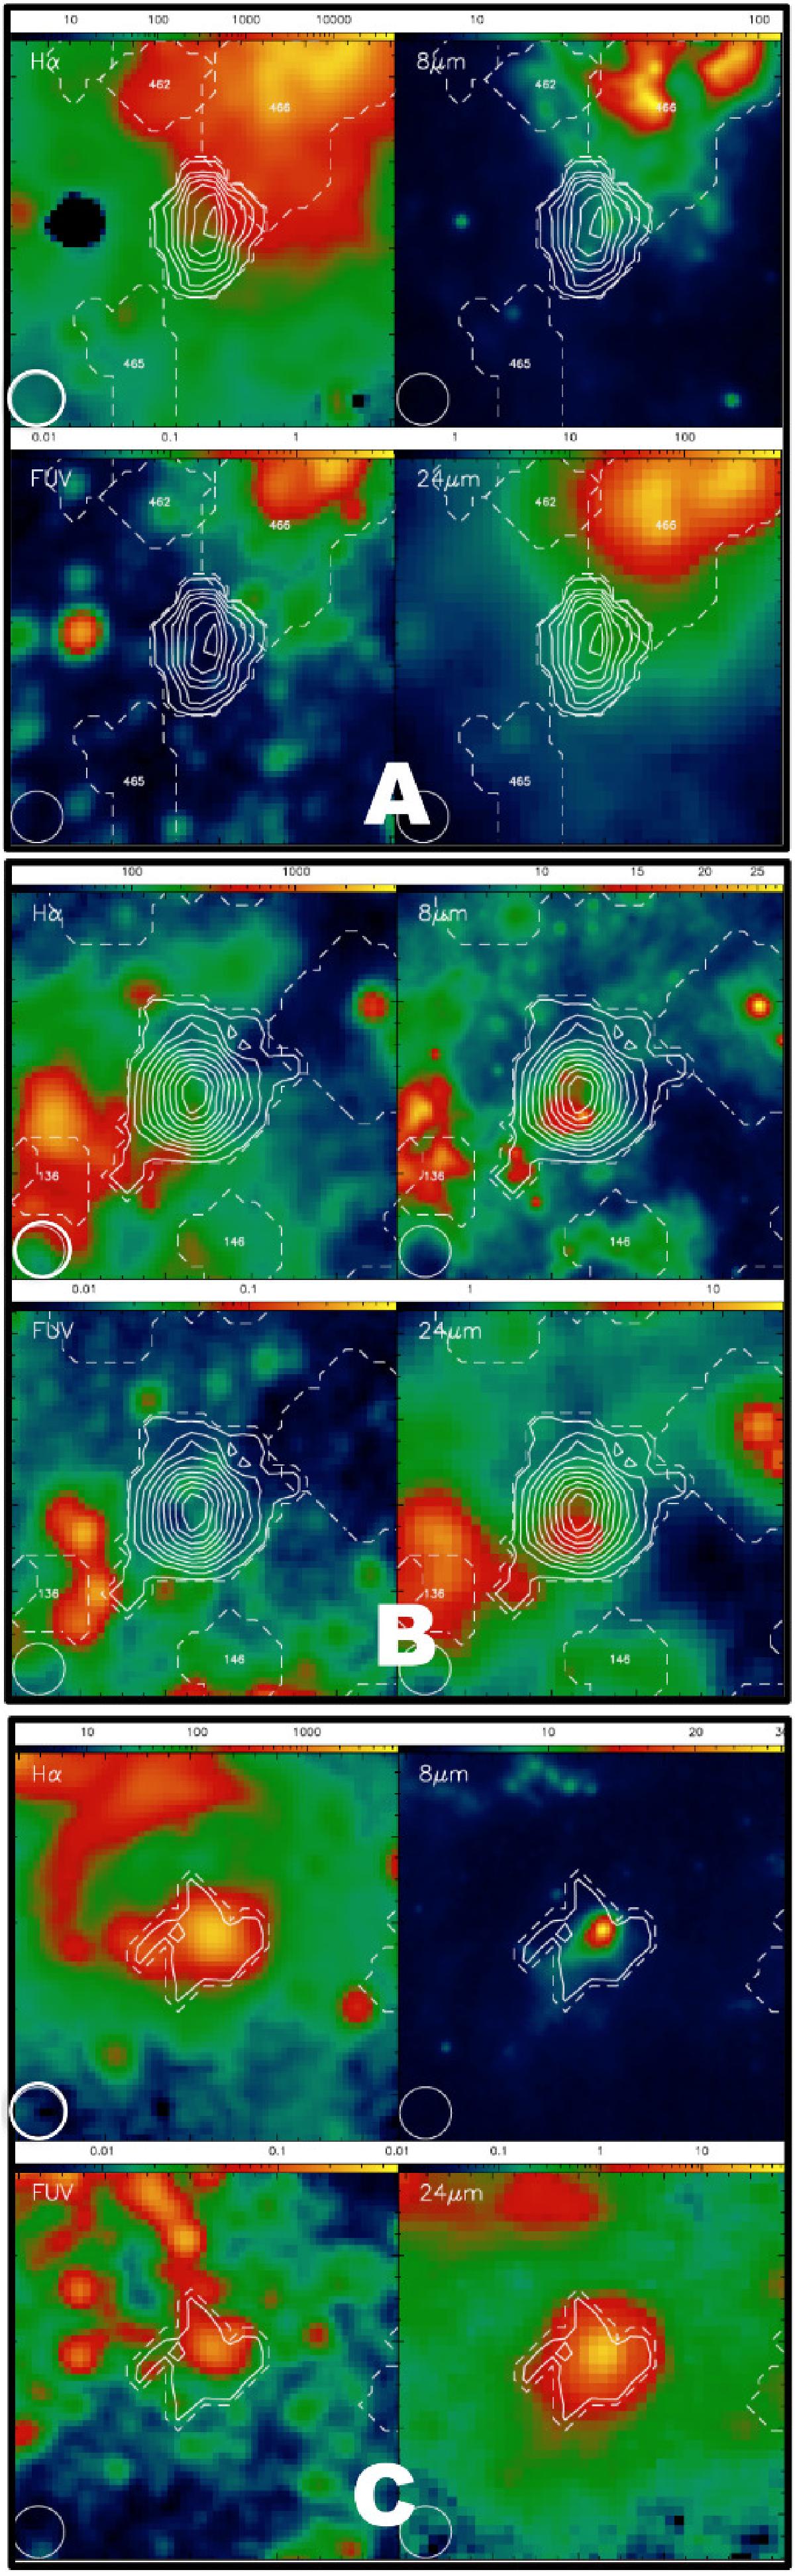
Four images of three selected areas of the M 33 disk that we used to classify three GMCs: cloud 461 as inactive or A-type (top), cloud 147 with embedded SF or B-type (middle), and cloud 15 with exposed SF or C-type (bottom). The CO J = 2−1 integrated intensity contours for each GMC (solid white line, first contour at 80 mK km s-1) are plotted on maps of Hα (upper left panel), Spitzer 8 μm (upper right panel), GALEX FUV (lower left panel), and Spitzer 24 μm (lower right panel). The CO J = 2−1 beam is plotted in the lower left corner of each panel and it is marked with a thicker line in the upper left panel.
Current usage metrics show cumulative count of Article Views (full-text article views including HTML views, PDF and ePub downloads, according to the available data) and Abstracts Views on Vision4Press platform.
Data correspond to usage on the plateform after 2015. The current usage metrics is available 48-96 hours after online publication and is updated daily on week days.
Initial download of the metrics may take a while.