Fig. 1
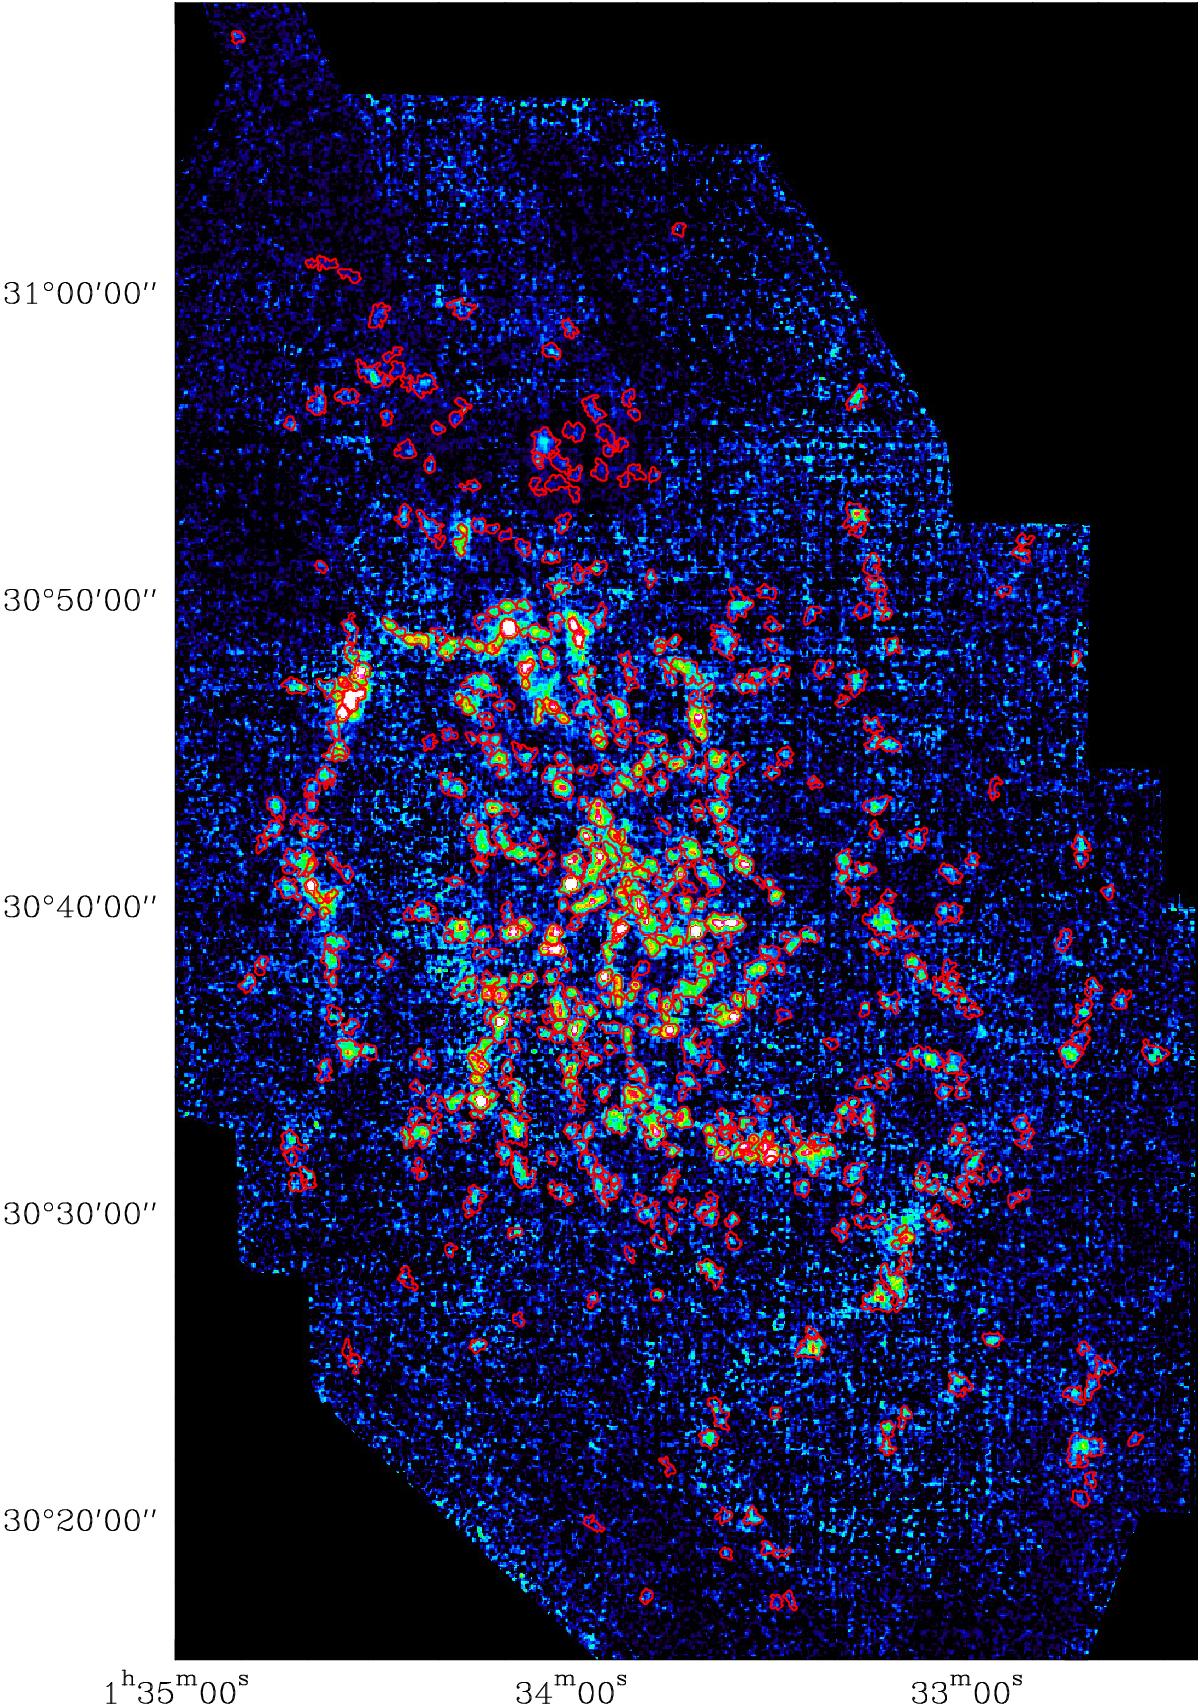
Molecular clouds in the catalogue plotted over the CO J = 2−1 integrated intensity emission map. The map rms is 0.2 K km s-1 and the intensity scale reaches a maximum of 4 K km s-1 in antenna temperature units. The thick red contour of each cloud corresponds to the deconvolved size and shape as determined by CPROPS (Rosolowsky & Leroy 2006).
Current usage metrics show cumulative count of Article Views (full-text article views including HTML views, PDF and ePub downloads, according to the available data) and Abstracts Views on Vision4Press platform.
Data correspond to usage on the plateform after 2015. The current usage metrics is available 48-96 hours after online publication and is updated daily on week days.
Initial download of the metrics may take a while.