Fig. 6
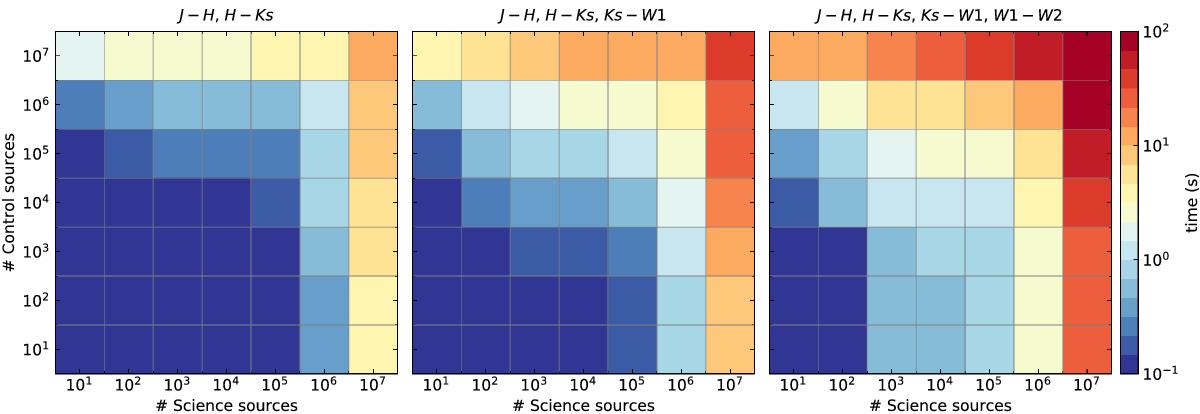
Pnicer performance results. For the tests displayed in the left-most panel two features were used (J−H, H−Ks), for the panel in the center three features, and for the right-most results four features. The colors of each matrix element display the code execution time for a given setup where the number of sources in the science field and the number of sources in the control field are incrementally increased. While for typical applications for a few thousand to a few ten thousand sources the de-reddening process finishes in a fraction of a second, only for extreme (and probably rare) use cases (107 sources) we measure execution times longer than a minute.
Current usage metrics show cumulative count of Article Views (full-text article views including HTML views, PDF and ePub downloads, according to the available data) and Abstracts Views on Vision4Press platform.
Data correspond to usage on the plateform after 2015. The current usage metrics is available 48-96 hours after online publication and is updated daily on week days.
Initial download of the metrics may take a while.