Fig. 2
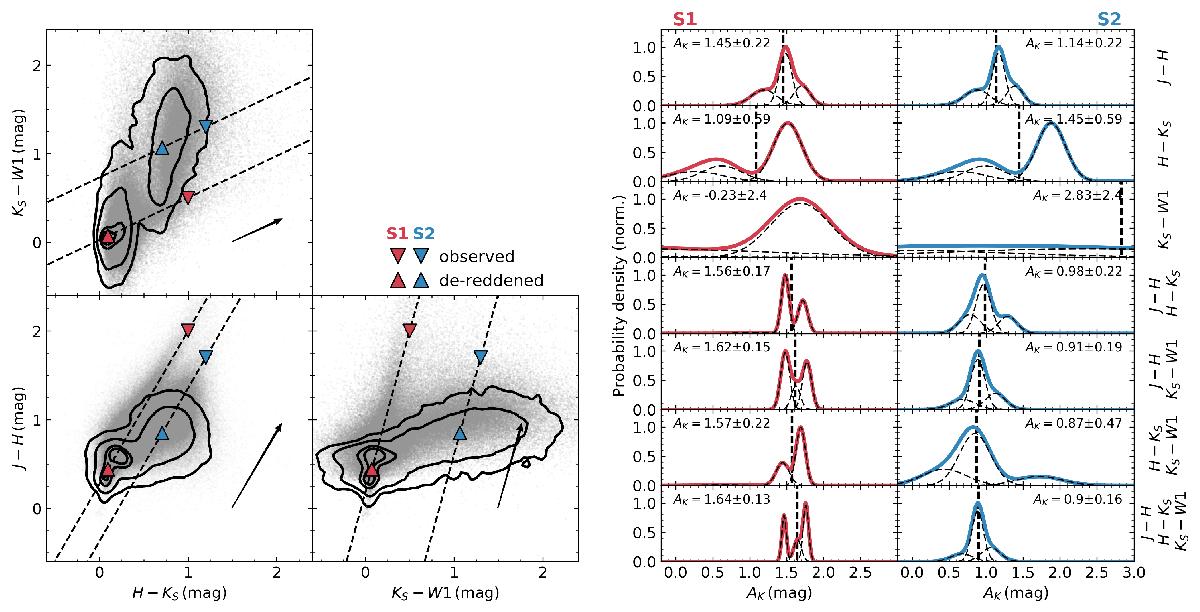
Pnicer method concept. Left: VISION Orion A data (gray points) and extinction-free control field number density distribution (black solid contours, levels at 0.5%, 3%, 25%, and 50% of the maximum density) for the two-dimensional feature combinations in our test setup. For two test sources S1 (red) and S2 (blue) the extinction is described with the PDF along the reddening vector (black dashed lines) in the control field. Right: probability densities functions described by GMMs along the reddening vector for both sources (S1: red, left column, S2: blue, right column) for all possible combinations of features. Individual combinations are shown in different rows and their labels are found at the right-hand side. The individual Gaussian components are also displayed as dashed lines. The annotated extinction estimates refer to the expected value (also marked as vertical dashed lines) of the PDF and its population variance. The PDF with the minimum population variance is chosen as the best approximation for the line-of-sight extinction. In this example the extinction is estimated via the expected value of the PDFs and is marked with dashed vertical black lines.
Current usage metrics show cumulative count of Article Views (full-text article views including HTML views, PDF and ePub downloads, according to the available data) and Abstracts Views on Vision4Press platform.
Data correspond to usage on the plateform after 2015. The current usage metrics is available 48-96 hours after online publication and is updated daily on week days.
Initial download of the metrics may take a while.