Fig. 1
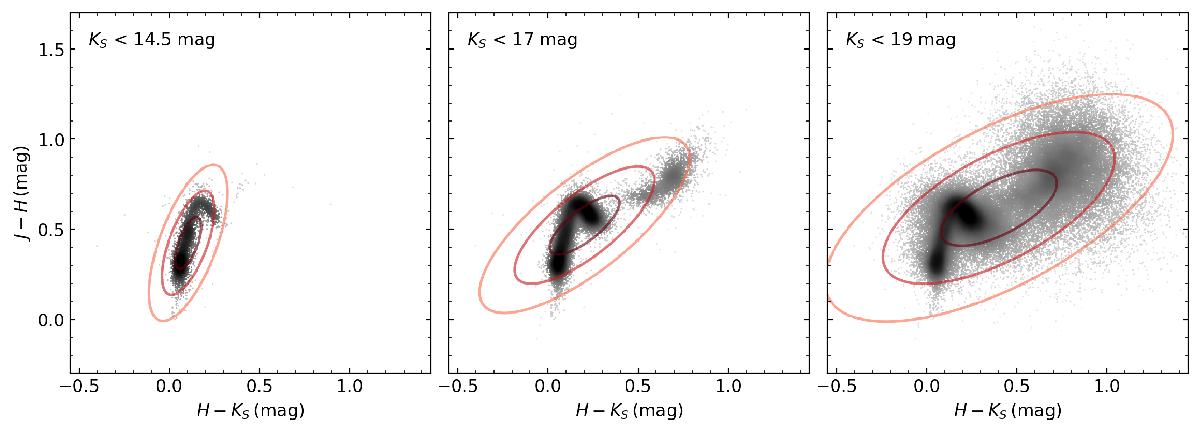
Color–color diagram of the NIR data from Meingast et al. (2016) for different magnitudes limits. The red ellipses are the covariance estimates drawn for one, two, and three standard deviations. We find a relatively small distribution width for the typical 2MASS magnitude limit at KS ~ 14.5 mag in both axes which allows for an efficient description of intrinsic colors via a mean and covariance estimate. By increasing the magnitude limit, galaxies at H−KS ~ 0.7, J−H ~ 0.8 mag significantly broaden the distribution and introduce a large statistical error when estimating intrinsic colors with a single averaged value. Also very well visible is the shift of the mean intrinsic color (i.e., the center of the ellipse) even beyond the M-branch of the stellar main sequence toward galaxies.
Current usage metrics show cumulative count of Article Views (full-text article views including HTML views, PDF and ePub downloads, according to the available data) and Abstracts Views on Vision4Press platform.
Data correspond to usage on the plateform after 2015. The current usage metrics is available 48-96 hours after online publication and is updated daily on week days.
Initial download of the metrics may take a while.