Fig. 9
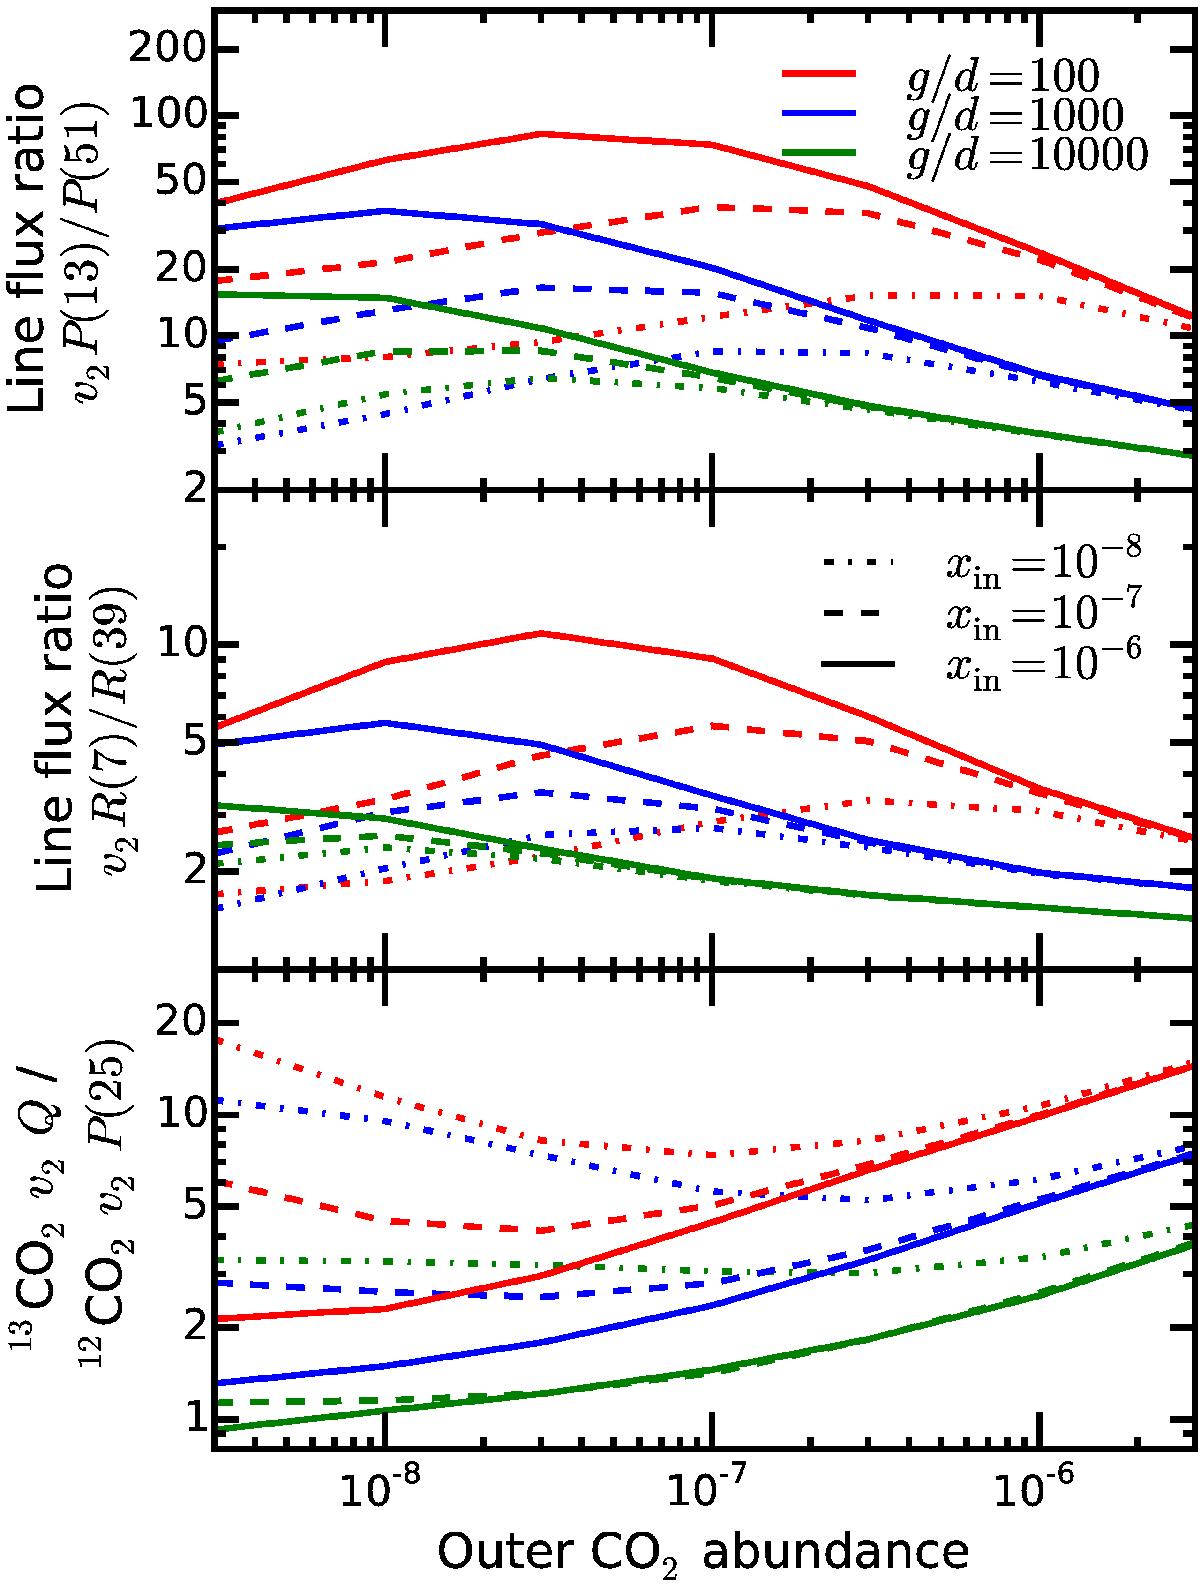
Line ratios as functions of outer abundance, inner abundance and gas to dust ratio (g/dgas). One line ratio in the P branch (P(15):P(51)) (top panel), one line ratio in the R branch (R(7):R(39)) (middle panel) of the 0110 → 0000 15 μm transition are shown together with the line ratio between the 13CO2Q-branch and the neighbouring 12CO2P(25) line. See the main text for more details.
Current usage metrics show cumulative count of Article Views (full-text article views including HTML views, PDF and ePub downloads, according to the available data) and Abstracts Views on Vision4Press platform.
Data correspond to usage on the plateform after 2015. The current usage metrics is available 48-96 hours after online publication and is updated daily on week days.
Initial download of the metrics may take a while.