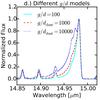
Fig. 7
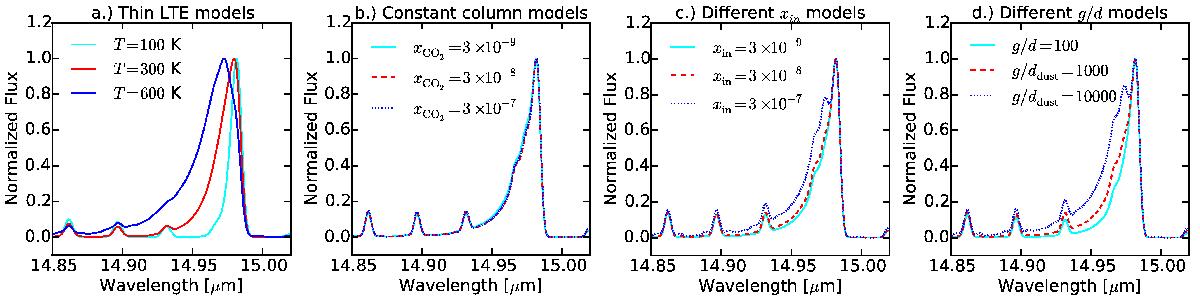
Q-branch profiles of different models shown at JWST-MIRI resolving power. All fluxes are normalized to the maximum of the feature. In panel a) LTE point models with a temperature of 200K (cyan), 400 K (red) and 800 K (blue) are shown. Panel b) shows DALI disk models with a constant abundance profile for which the product of abundance times gas-to-dust ratio is constant. All these models have very similar total fluxes. The models shown are g/dgas = 100, xCO2 = 3 × 10⁻⁷ in red; g/dgas = 1000, xCO2 = 3 × 10⁻⁸ in blue and g/dgas = 10000, xCO2 = 3 × 10⁻⁹ in cyan. The spectra are virtually indistinguishable. Panel c) shows DALI disk models with a jump abundance profile, a g/ddust = 1000, an outer CO2 abundance of 3 × 10⁻⁸ and an inner abundance of 3 × 10⁻⁷ (red), 3 × 10⁻⁸ (blue), 3 × 10⁻⁹ (cyan). The model with the highest inner abundance shows a profile that is slightly broader than those of the other two. Panel d) shows DALI disk models with the same, constant abundance of xCO2 = 3 × 10⁻⁸, but with different g/ddust ratios. Removing dust from the upper layers of the disk preferentially boosts the high J lines in the tail of the feature as emission from the dense and hot inner regions of the disk is less occulted by dust.
Current usage metrics show cumulative count of Article Views (full-text article views including HTML views, PDF and ePub downloads, according to the available data) and Abstracts Views on Vision4Press platform.
Data correspond to usage on the plateform after 2015. The current usage metrics is available 48-96 hours after online publication and is updated daily on week days.
Initial download of the metrics may take a while.