Fig. 3
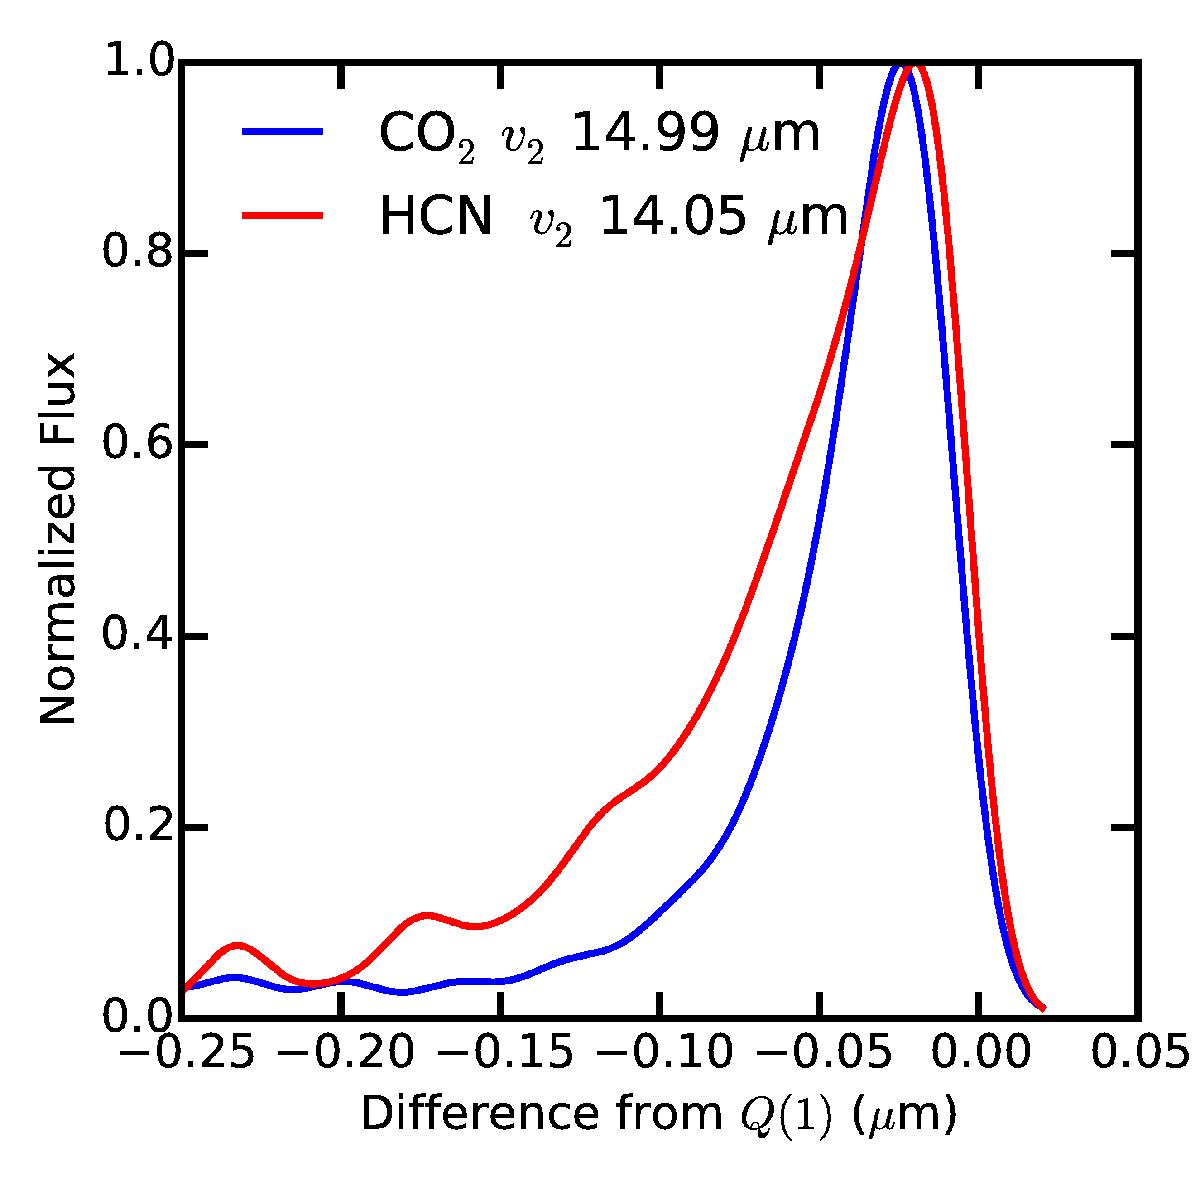
v2Q-branch profile of CO2 and HCN at a temperature of 400 K. Flux is plotted as function of the offset from the lowest energy line (wavelength given in the legend). The lines are convolved to a resolving power R = 600 appropriate for Spitzer data. The full width half maximum (FWHM) for CO2 and HCN are 0.4 and 0.6 μm respectively.
Current usage metrics show cumulative count of Article Views (full-text article views including HTML views, PDF and ePub downloads, according to the available data) and Abstracts Views on Vision4Press platform.
Data correspond to usage on the plateform after 2015. The current usage metrics is available 48-96 hours after online publication and is updated daily on week days.
Initial download of the metrics may take a while.