Fig. F.1
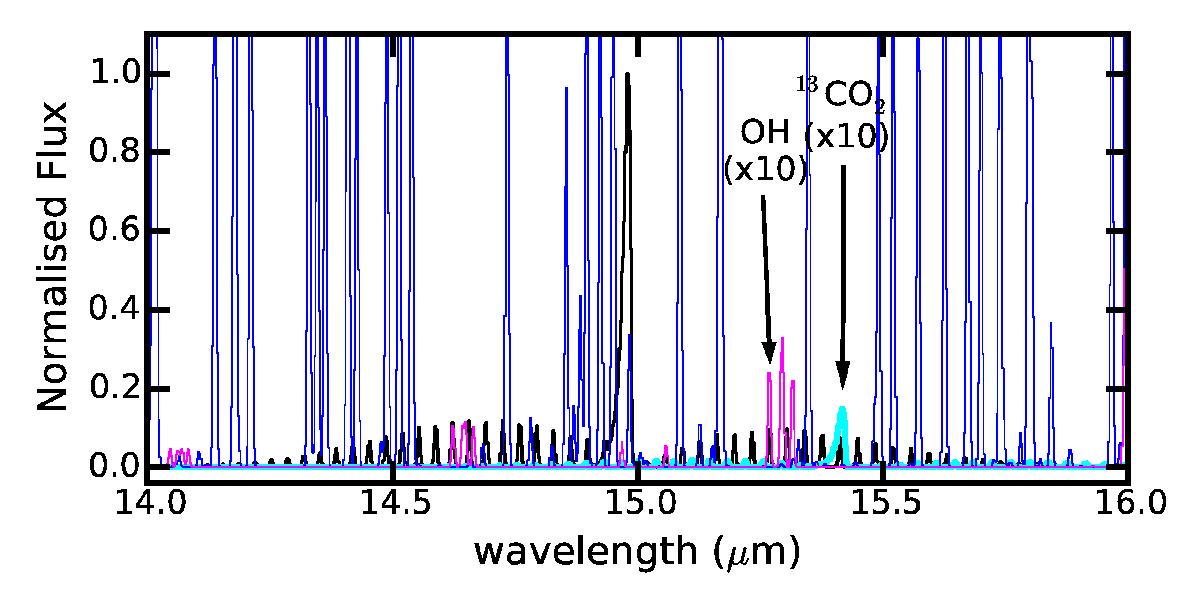
Slab model spectrum comparing CO2 emission (black) and 13CO2 emission (cyan) with the H2O emission (blue) and OH emission (magenta) at a resolving power of 2200. Slab models uses the parameters fitted by Salyk et al. (2011b) for AS 205 (N) (see Table F.1). The large number of strong water lines strongly contaminates the CO2 spectrum. All spectra are normalized to the peak of the CO2 emission. A lot of single water lines are up to four times as strong as the peak of the CO2 15 μm feature. The 13CO2 and OH fluxes have been multiplied by a factor of 10 for clarity.
Current usage metrics show cumulative count of Article Views (full-text article views including HTML views, PDF and ePub downloads, according to the available data) and Abstracts Views on Vision4Press platform.
Data correspond to usage on the plateform after 2015. The current usage metrics is available 48-96 hours after online publication and is updated daily on week days.
Initial download of the metrics may take a while.