Fig. C.1
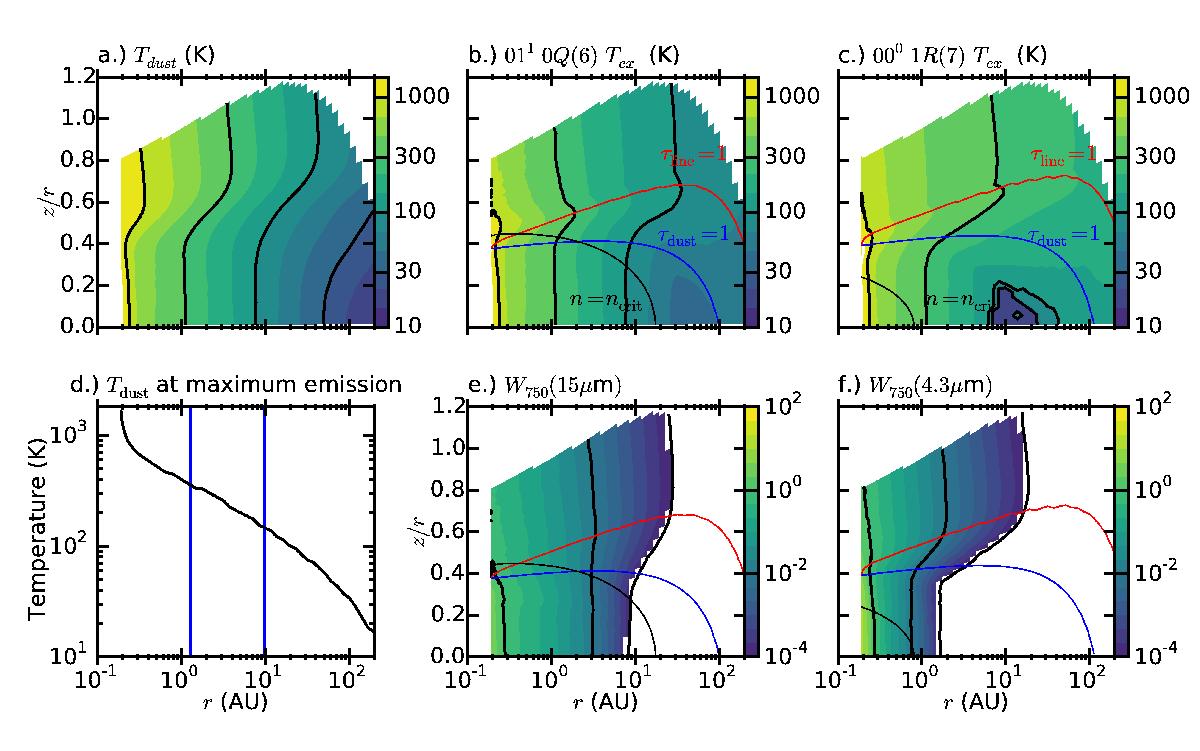
Dust temperature, excitation temperature and radiation field for a model with g/dgas = 1000, and a constant abundance of 10-7. The red line in panels b), c), e) and f) shows the CO2 line τ = 1 surface, the blue line shows the τ = 1 line for the dust. Panel d) shows the dust temperature at the height from which most of the emission of the 15 μm Q(6) line originates as function of radius. The vertical blue lines enclose the radii that account for 50% of the emission.
Current usage metrics show cumulative count of Article Views (full-text article views including HTML views, PDF and ePub downloads, according to the available data) and Abstracts Views on Vision4Press platform.
Data correspond to usage on the plateform after 2015. The current usage metrics is available 48-96 hours after online publication and is updated daily on week days.
Initial download of the metrics may take a while.