Fig. 15
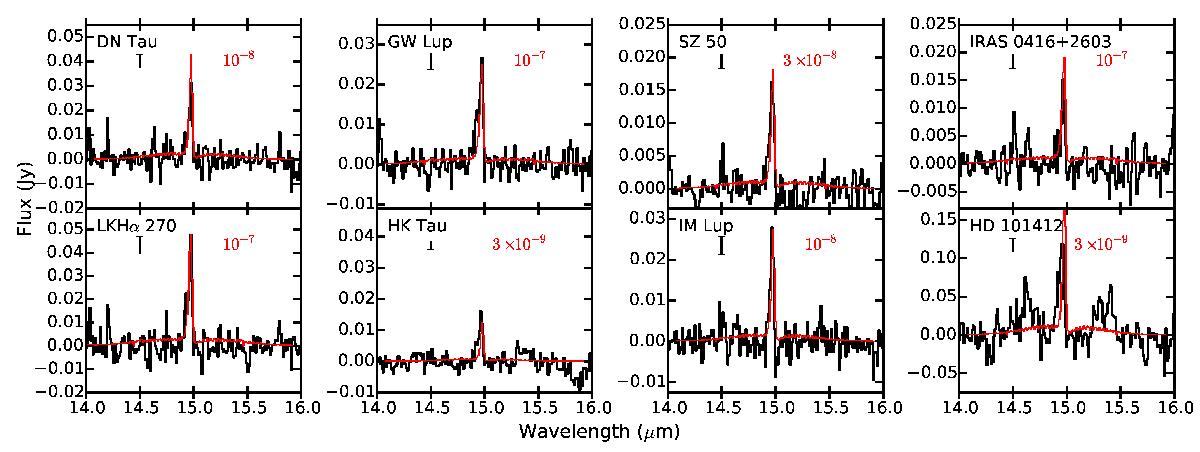
Continuum subtracted spectra (black) with DALI CO2 emission models (red) for the eight selected sources. The abundance used in the DALI model is given in each frame, taken to be constant over the whole disk. The line fluxes have been corrected for the distances to the sources. The errorbar in the top left corner of each panel shows the median errorbar on the data.
Current usage metrics show cumulative count of Article Views (full-text article views including HTML views, PDF and ePub downloads, according to the available data) and Abstracts Views on Vision4Press platform.
Data correspond to usage on the plateform after 2015. The current usage metrics is available 48-96 hours after online publication and is updated daily on week days.
Initial download of the metrics may take a while.