Fig. 13
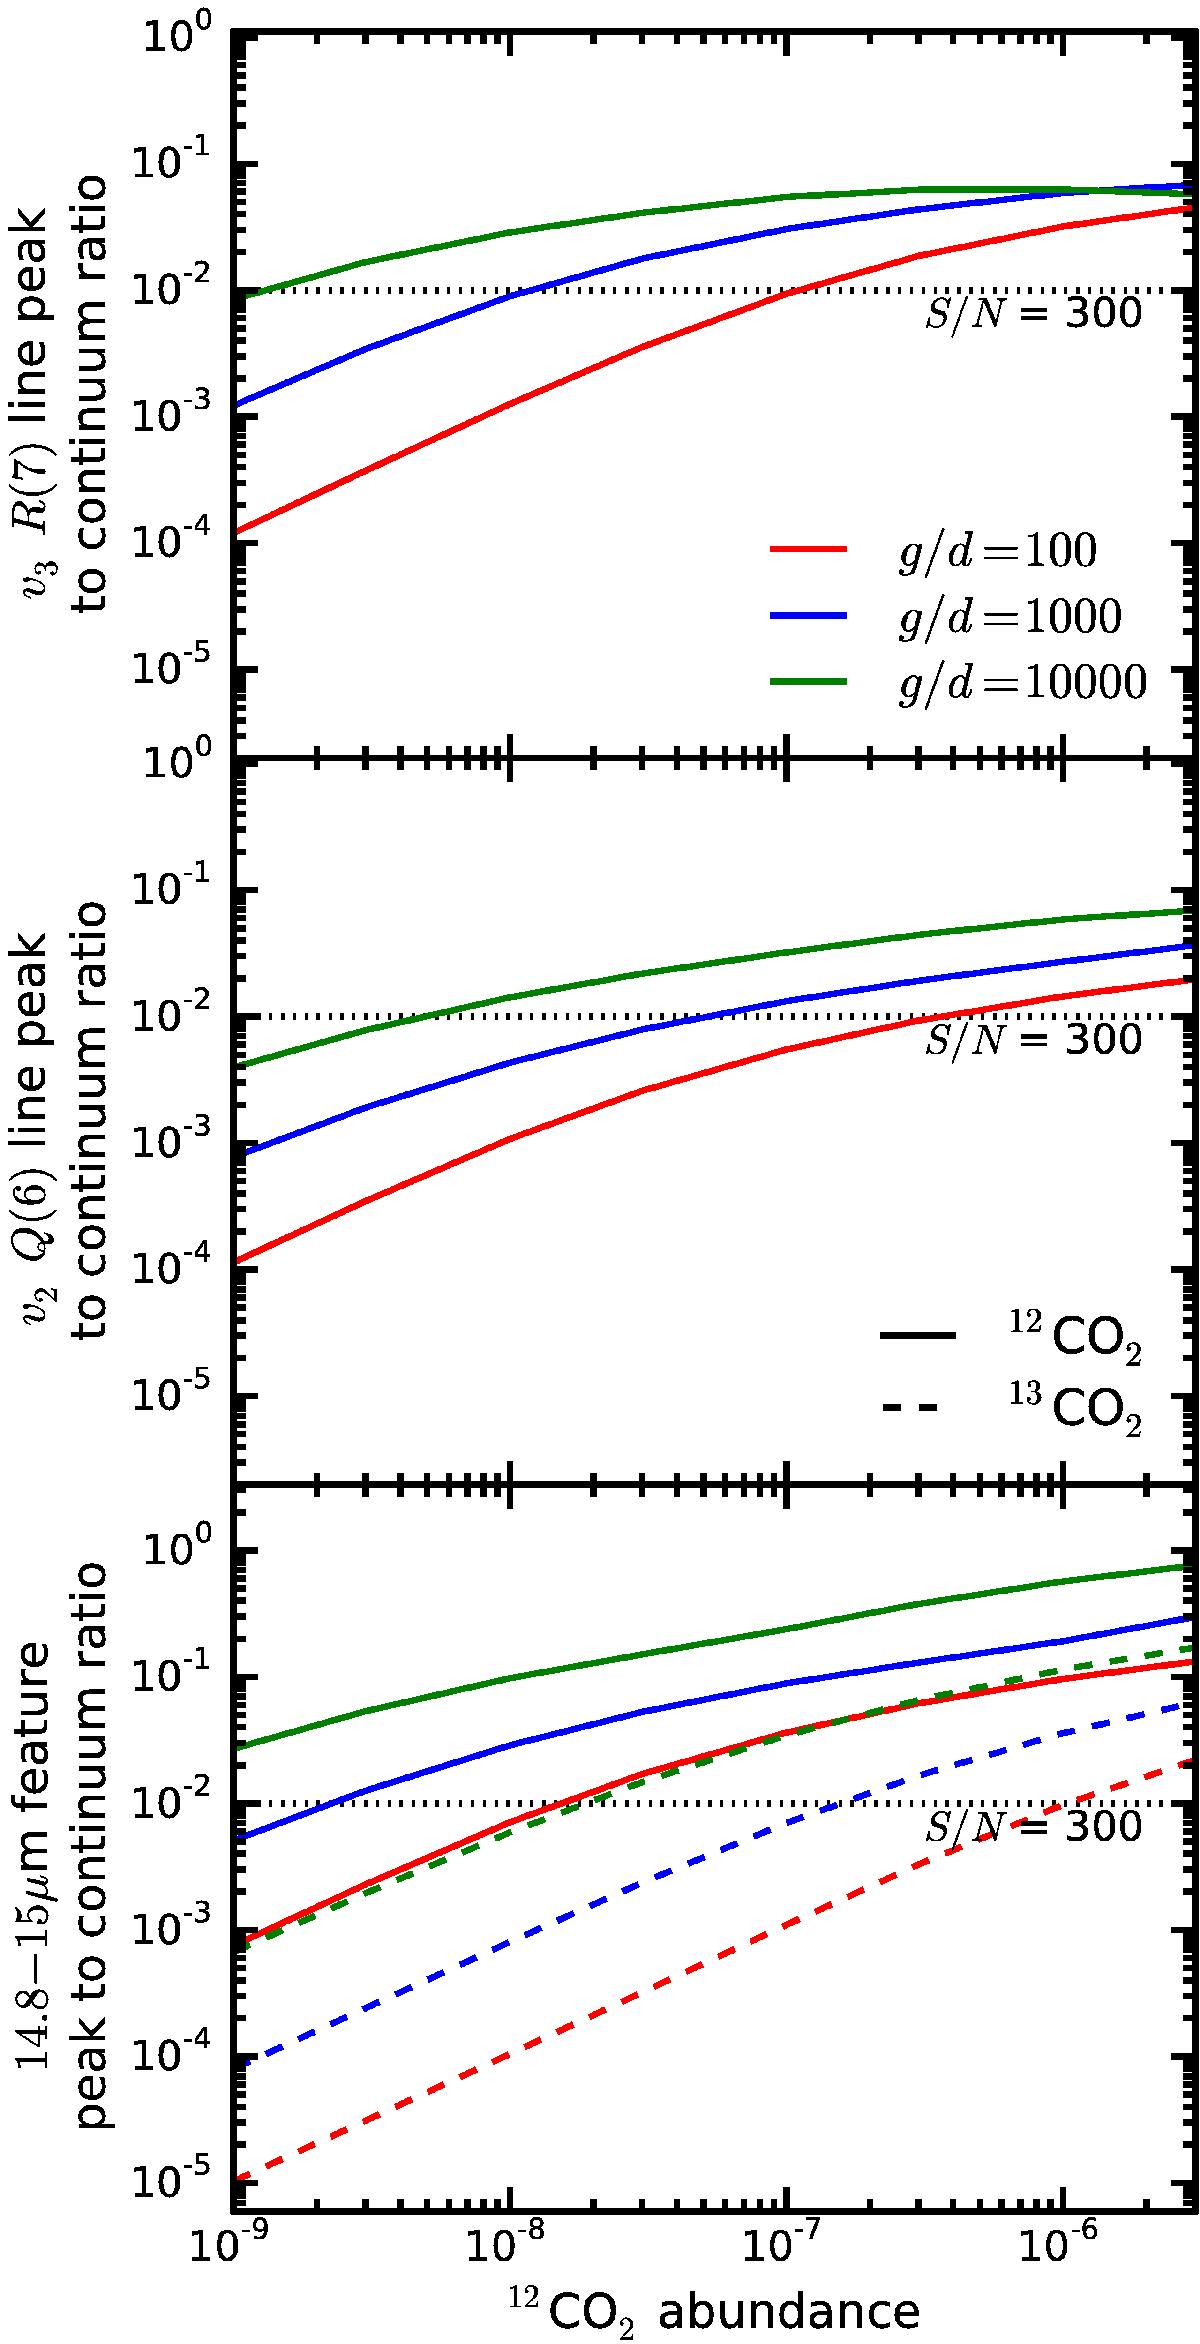
Line-to-continuum for 12CO2 as function of abundance for different gas-to-dust ratios in solid lines. In the bottom plot the line-to-continuum for 13CO2Q-branch is shown in dashed lines. A dotted black line shows a line-to-continuum of 0.01, lines with this line-to-continuum ratio can be observed if the signal-to-noise (S/N) on the continuum is more than 300. With a S/N on the continuum of 300, observations of the Q-branch should be able to probe down to 10-9 in abundance for a gas-to-dust ratio of 1000. With similar gas-to-dust ratio and S/N, individual lines the 15 μm band will only be observable in disk with CO2 abundances higher than 3 × 10⁻⁸.
Current usage metrics show cumulative count of Article Views (full-text article views including HTML views, PDF and ePub downloads, according to the available data) and Abstracts Views on Vision4Press platform.
Data correspond to usage on the plateform after 2015. The current usage metrics is available 48-96 hours after online publication and is updated daily on week days.
Initial download of the metrics may take a while.