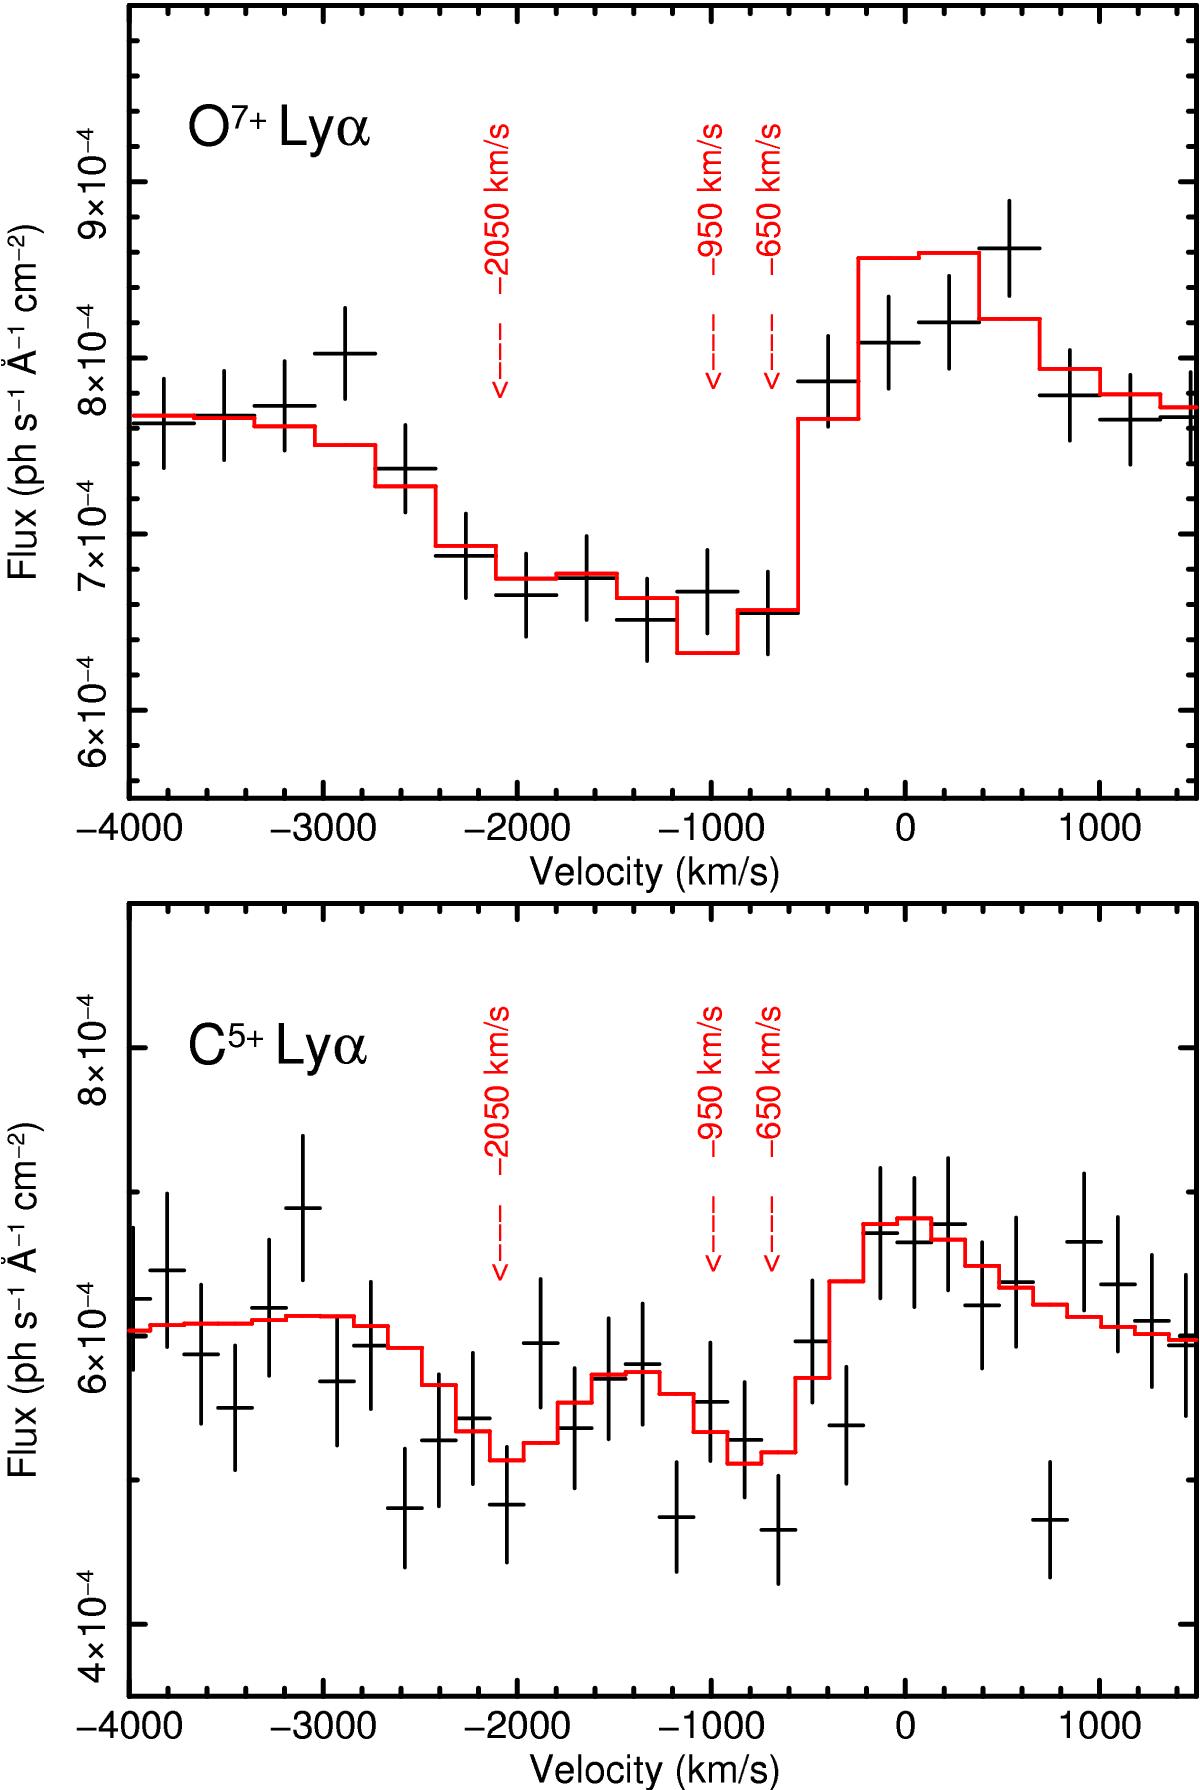
Fig. 5

Spectral region of the H-like O7+ and C5+ Lyα lines demonstrating the contribution of the three absorption components (marked in figure) and a broad (FWHM = 1400 km s-1) emission component (not marked) centered at –450 km s-1. The instrumental spectral resolution is ~1000 km s-1 at the O7+ line and ~600 km s-1 at the C5+ line, as can be seen from the folded model (solid line). Note that the vertical flux scale does not go down to zero.
Current usage metrics show cumulative count of Article Views (full-text article views including HTML views, PDF and ePub downloads, according to the available data) and Abstracts Views on Vision4Press platform.
Data correspond to usage on the plateform after 2015. The current usage metrics is available 48-96 hours after online publication and is updated daily on week days.
Initial download of the metrics may take a while.


