Fig. 8
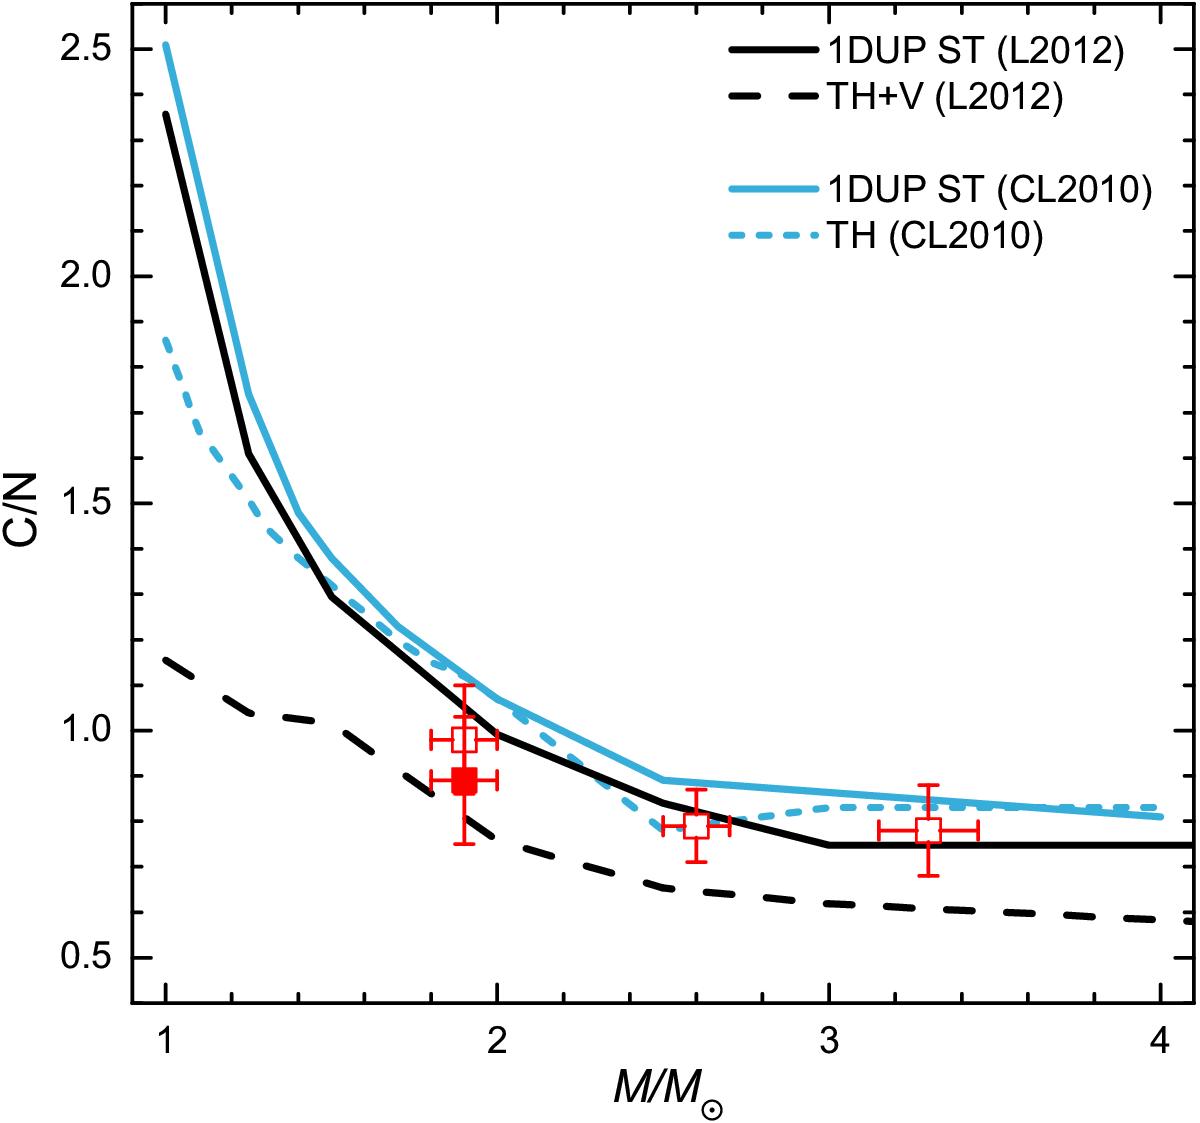
Mean C/N ratio of clump stars in open clusters as a function of turn-off mass. Three open clusters from T15 are labeled as open squares, while NGC 6802 is the filled square. The solid lines represent the C/N ratios predicted by the first dredge-up with standard stellar evolutionary models in Charbonnel & Lagarde (2010; blue solid line) or Lagarde et al. (2012; black solid line). The blue dashed line shows the prediction when just thermohaline extra-mixing is introduced (Charbonnel & Lagarde 2010), and the black dashed line is for the model that includes both the thermohaline and rotation induced mixing (Lagarde et al. 2012).
Current usage metrics show cumulative count of Article Views (full-text article views including HTML views, PDF and ePub downloads, according to the available data) and Abstracts Views on Vision4Press platform.
Data correspond to usage on the plateform after 2015. The current usage metrics is available 48-96 hours after online publication and is updated daily on week days.
Initial download of the metrics may take a while.