Free Access
Fig. 2
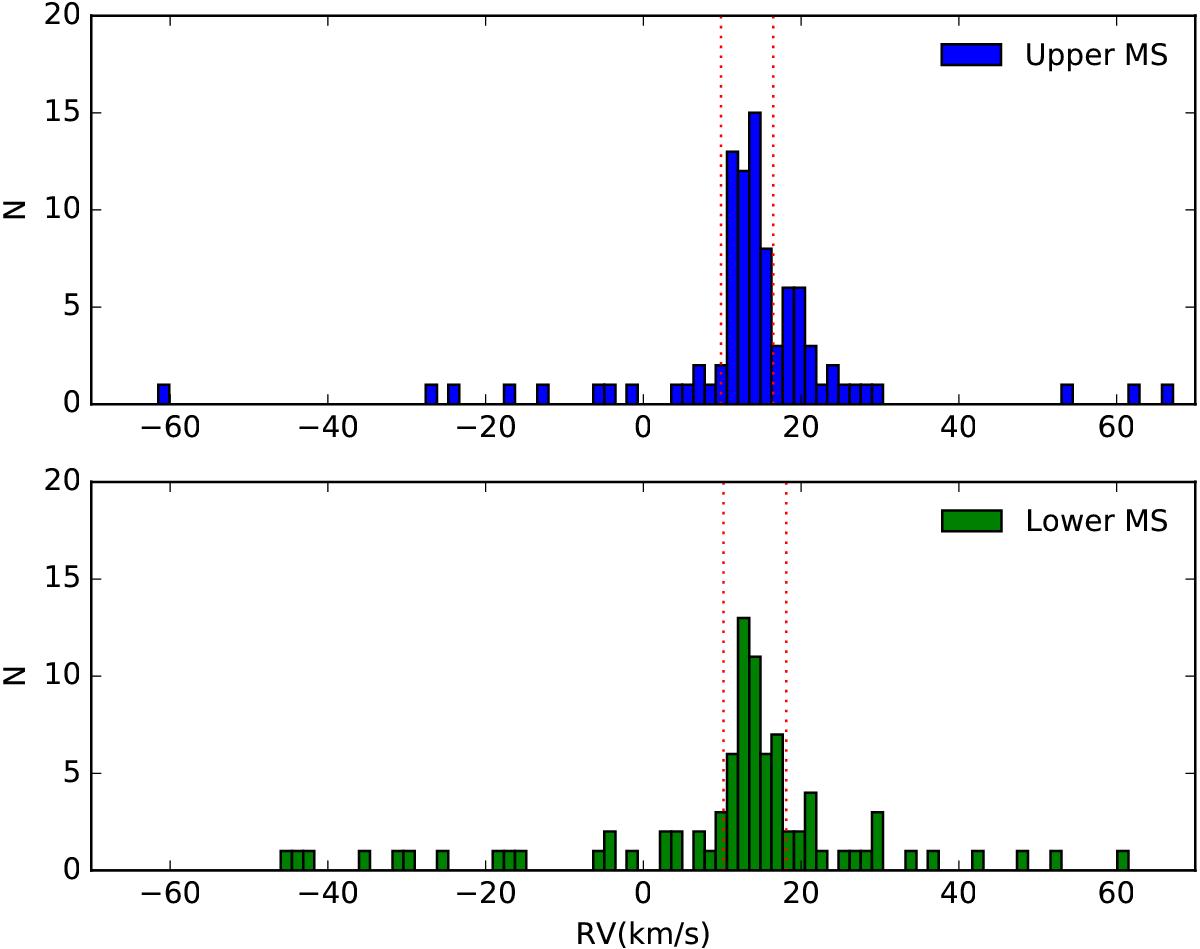
Radial velocity distributions for upper main sequence stars (upper panel) and lower main sequence stars (lower panel). The red dotted lines of each panel indicate the lower and upper limits of the 2-sigma cut used to limit cluster membership. See text for more details.
Current usage metrics show cumulative count of Article Views (full-text article views including HTML views, PDF and ePub downloads, according to the available data) and Abstracts Views on Vision4Press platform.
Data correspond to usage on the plateform after 2015. The current usage metrics is available 48-96 hours after online publication and is updated daily on week days.
Initial download of the metrics may take a while.