Fig. 11
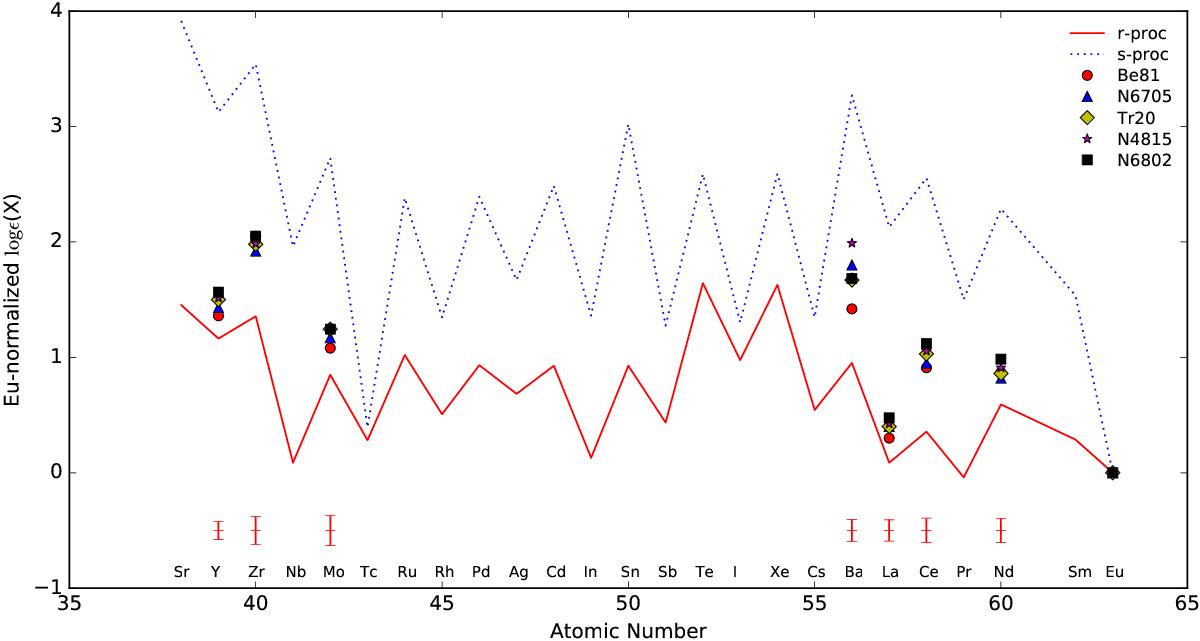
Eu-normalized log ϵ(X) as a function of atomic number for the five IOCs. The solar element r-process and s-process abundance distributions from Simmerer et al. (2004) are shown as red and blue solid lines, respectively. The element names are listed in the bottom of the panel, and the error bars indicate the standard deviations of the seven s-process elements discussed in this work.
Current usage metrics show cumulative count of Article Views (full-text article views including HTML views, PDF and ePub downloads, according to the available data) and Abstracts Views on Vision4Press platform.
Data correspond to usage on the plateform after 2015. The current usage metrics is available 48-96 hours after online publication and is updated daily on week days.
Initial download of the metrics may take a while.