Fig. 7
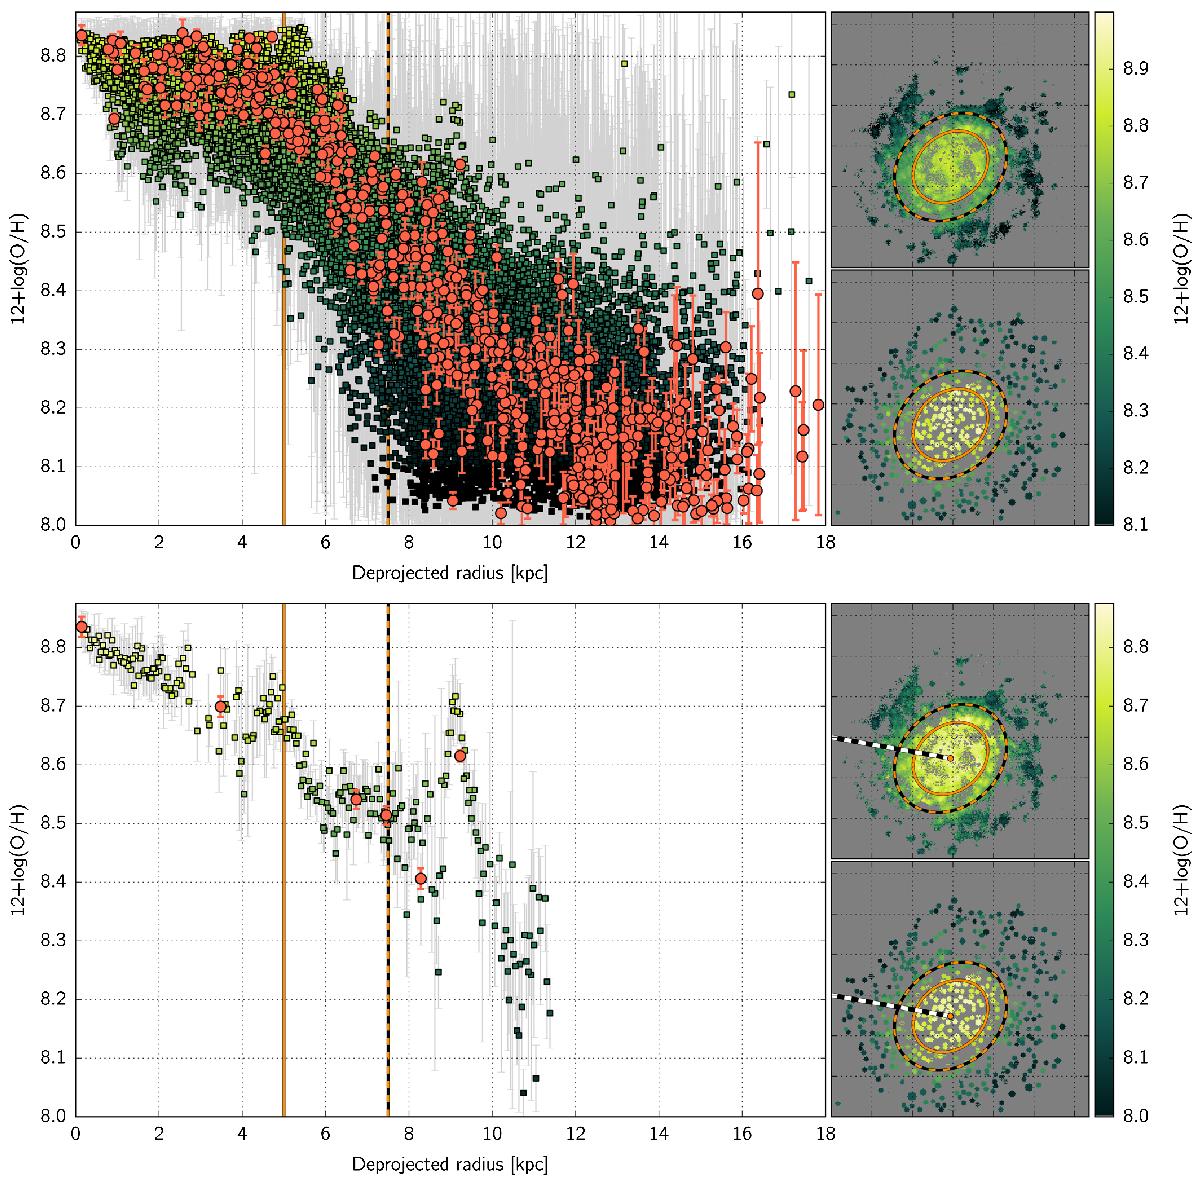
Global oxygen abundance gradient (top panel) and for regions within 0.3 arcsec of the specific azimuth 79.5° East-of-North (i.e., the area between the white & black dashed line). Individual spaxels are shown as colored squares with the associated 1σ errors in gray. Measurements for apertures (with associated 1σ errors) are shown in red. Whereas, globally, the gradient in HCG 91c can be described as linear with a flattening inwards of 4 kpc and (possibly) outwards of 11 kpc, the trends are highly non-linear for individual azimuths. Rapid and localized variations, detected both in individual spaxels and integrated apertures alike are present at all radii. Ellipses marking the deprojected effective radius Re (5.1 kpc, orange) and 1.5 Re (dashed-orange) radius from the galaxy center are shown in all oxygen abundance maps (both spaxel-based and aperture based).
Current usage metrics show cumulative count of Article Views (full-text article views including HTML views, PDF and ePub downloads, according to the available data) and Abstracts Views on Vision4Press platform.
Data correspond to usage on the plateform after 2015. The current usage metrics is available 48-96 hours after online publication and is updated daily on week days.
Initial download of the metrics may take a while.