Fig. 5
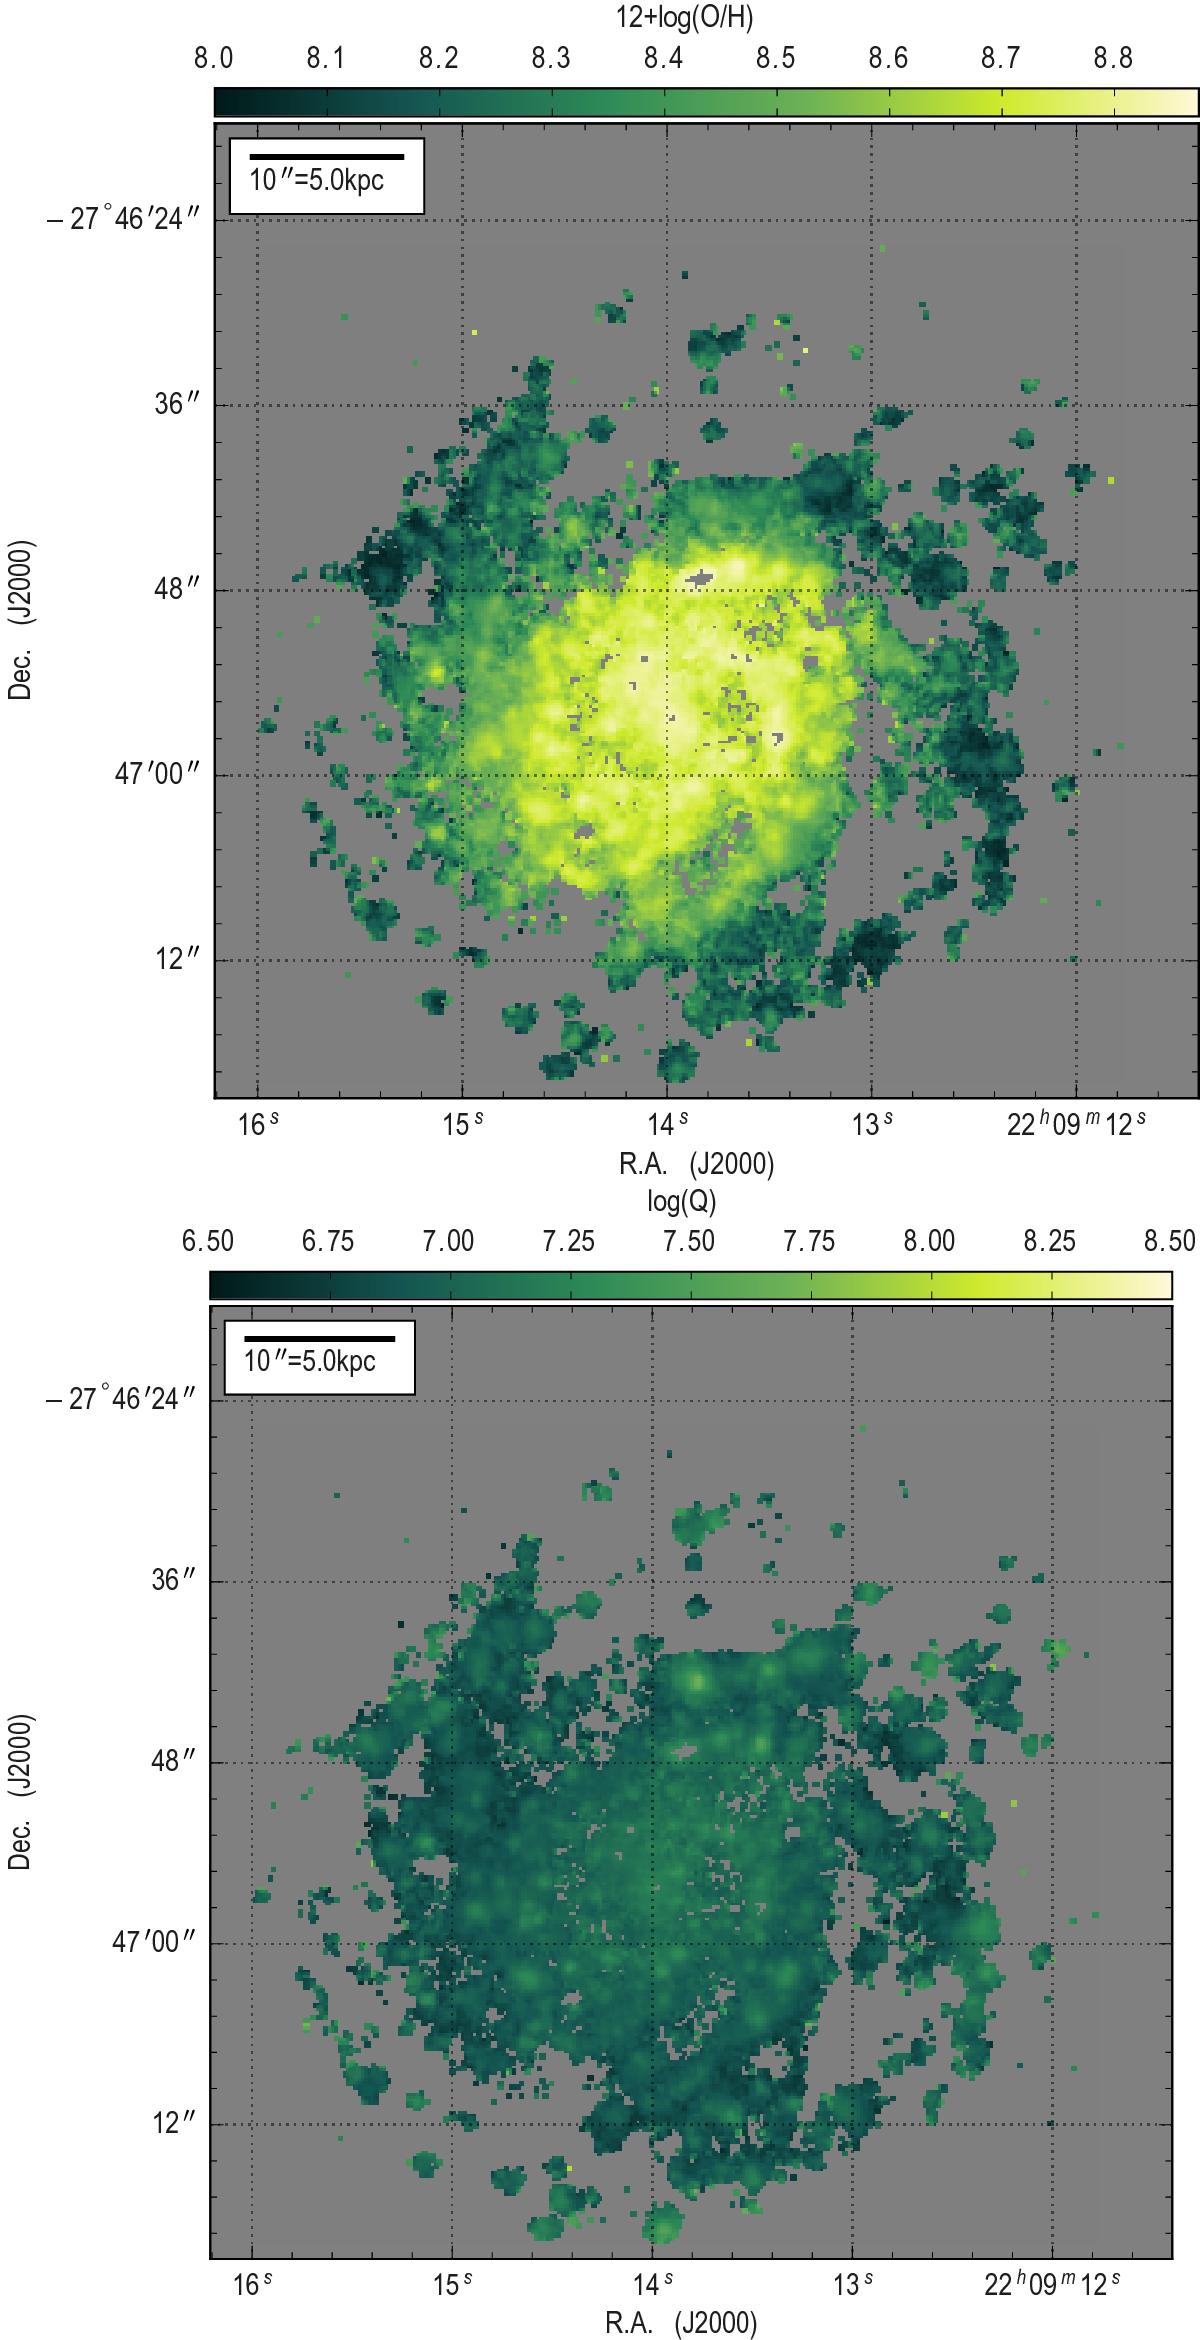
Spaxel-based map of the oxygen abundance (top) and ionization parameter (bottom) in HCG 91c, constructed using the brutus and pyqz codes. The color bars span the full range of values covered by the mappings v simulations, highlighting the large range of oxygen abundances and narrower range of ionization parameters throughout the galaxy.
Current usage metrics show cumulative count of Article Views (full-text article views including HTML views, PDF and ePub downloads, according to the available data) and Abstracts Views on Vision4Press platform.
Data correspond to usage on the plateform after 2015. The current usage metrics is available 48-96 hours after online publication and is updated daily on week days.
Initial download of the metrics may take a while.