Fig. 4
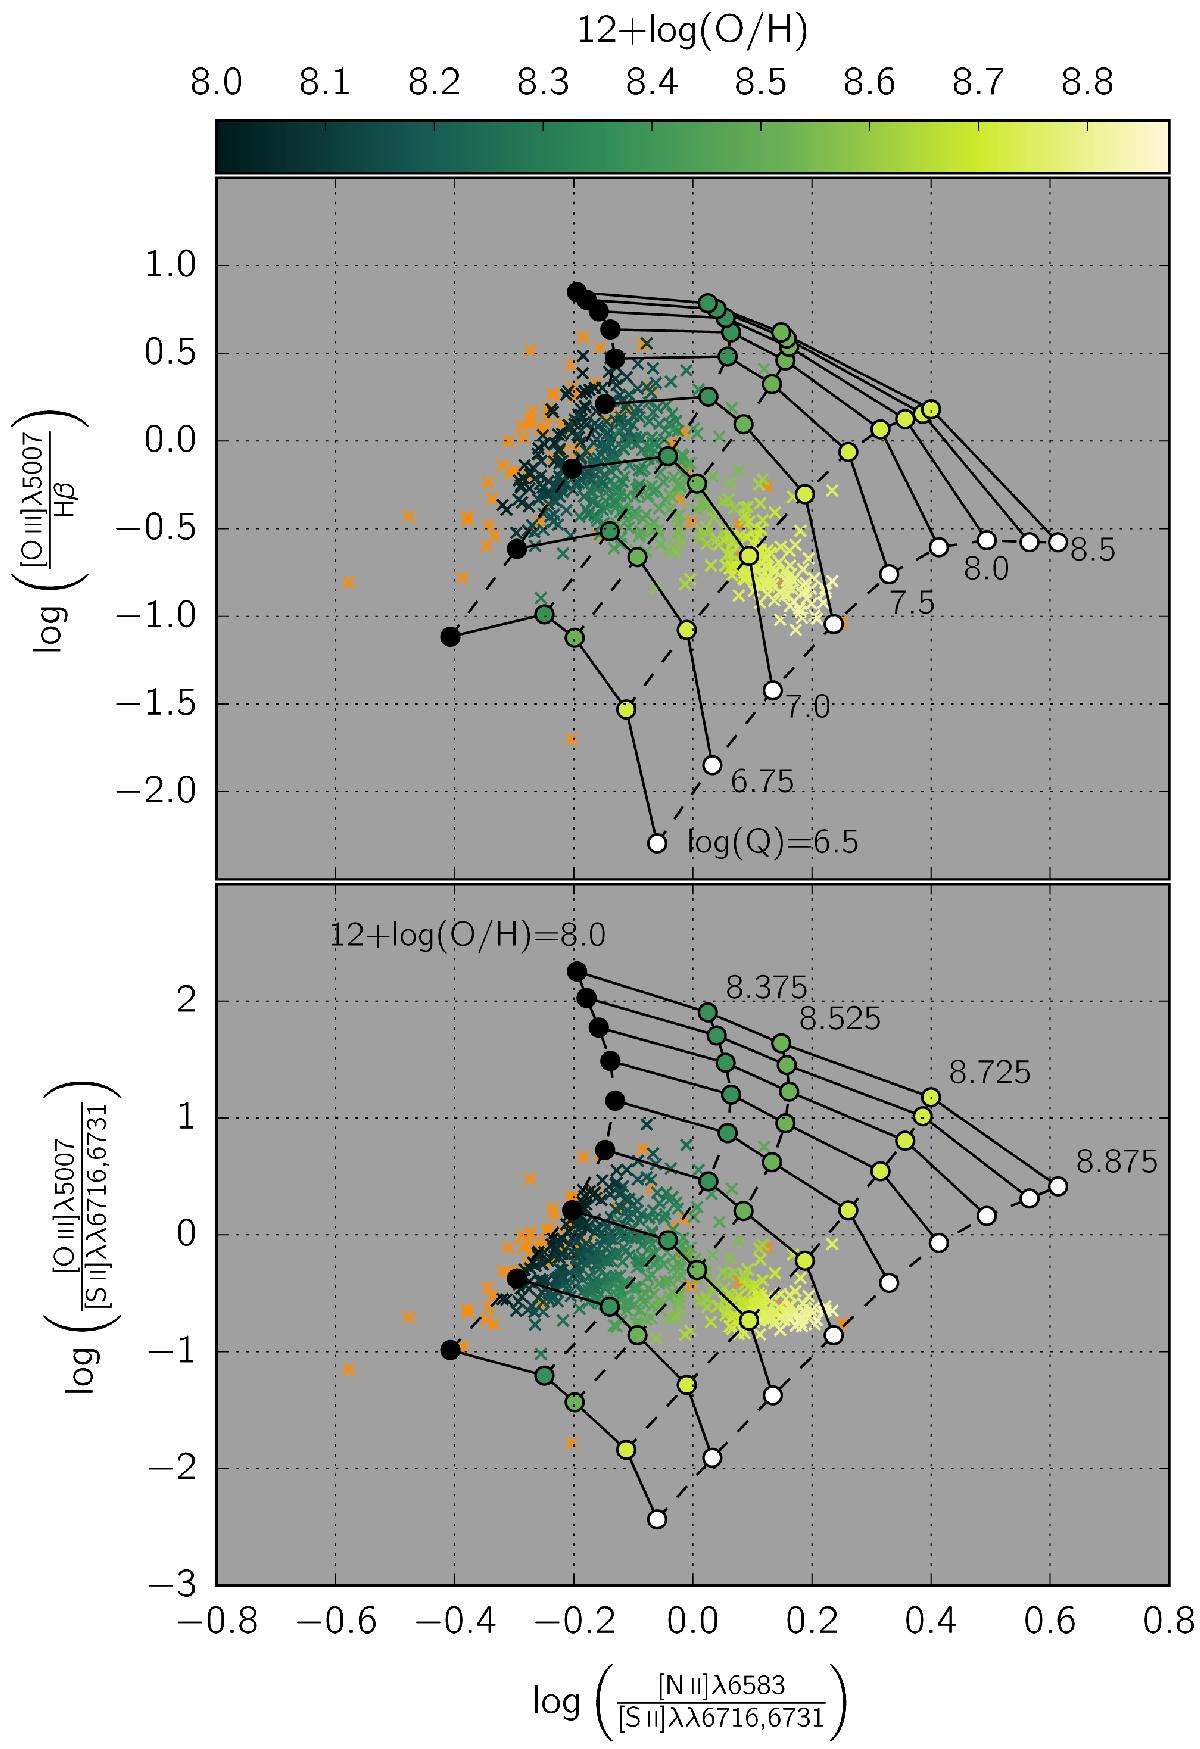
Emission line ratio diagnostic grids from the mappings 5.1 photo-ionization code for a plane-parallel geometry with Pk = 5.0 and κ = ∞. Each circle corresponds to one simulation with a specific abundance and ionization parameter. Small crosses indicate the location of each of the 556 circular apertures, color-coded as a function of the combined (where suitable) abundance value derived from both diagnostics. Orange crosses mark the apertures for which pyqz could not derive a reliable abundance: either from an overly large discrepancy between both grids, or because the estimates fall outside both grids.
Current usage metrics show cumulative count of Article Views (full-text article views including HTML views, PDF and ePub downloads, according to the available data) and Abstracts Views on Vision4Press platform.
Data correspond to usage on the plateform after 2015. The current usage metrics is available 48-96 hours after online publication and is updated daily on week days.
Initial download of the metrics may take a while.