Free Access
Fig. 3
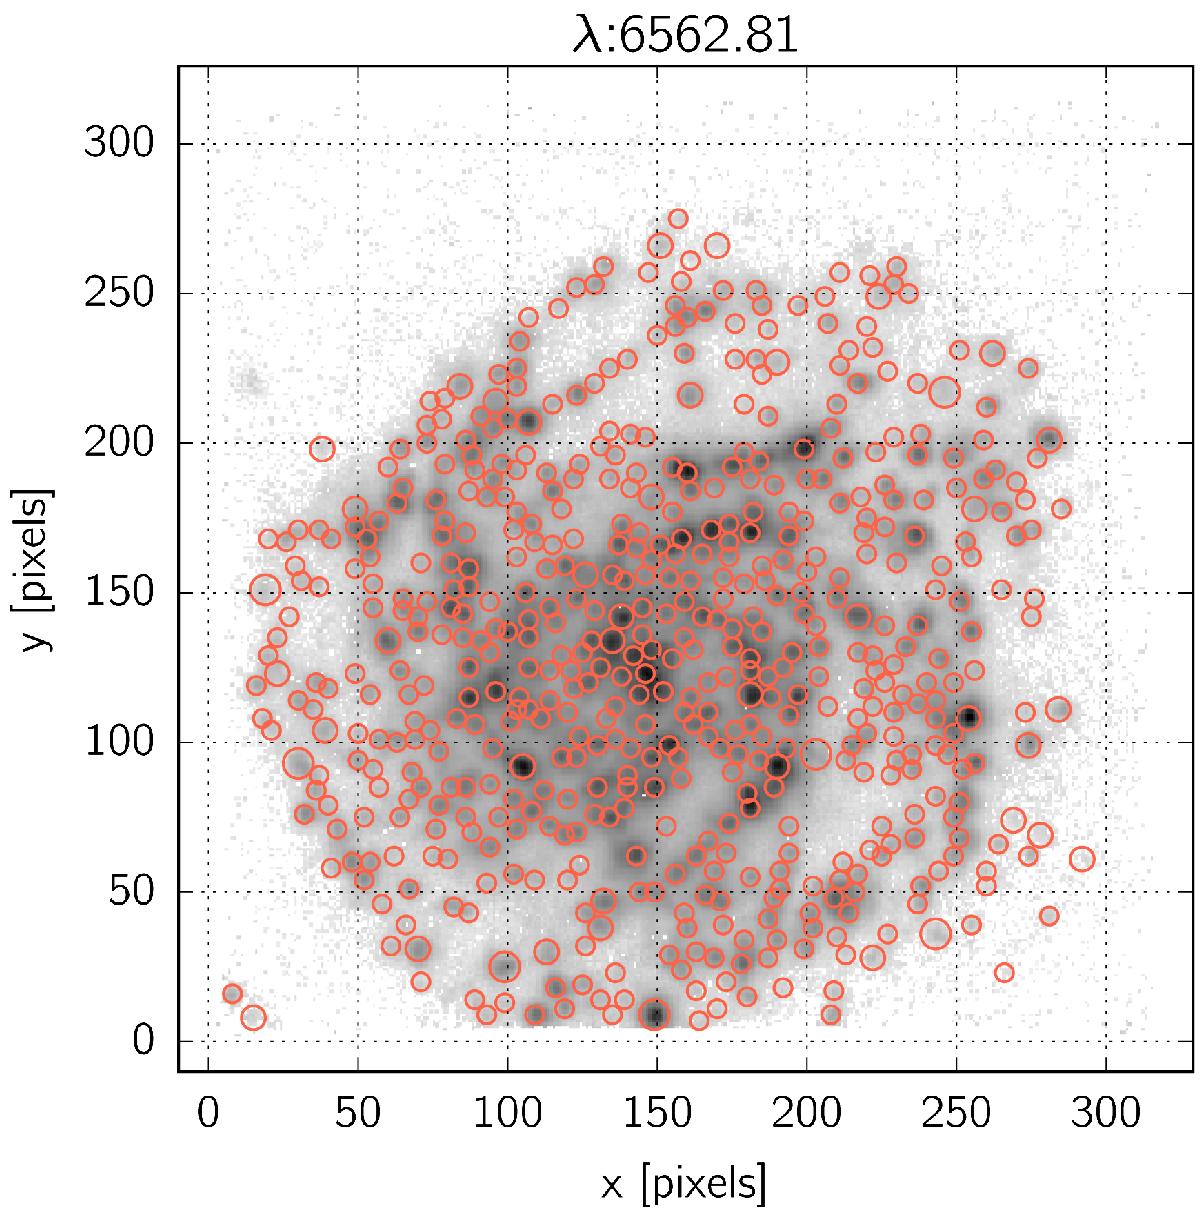
Hα flux map of HCG 91c overlaid with the 556 apertures associated with local maxima. The apertures were first identified automatically by brutus, and subsequently inspected and adjusted manually using a dedicated interactive module inside the code.
Current usage metrics show cumulative count of Article Views (full-text article views including HTML views, PDF and ePub downloads, according to the available data) and Abstracts Views on Vision4Press platform.
Data correspond to usage on the plateform after 2015. The current usage metrics is available 48-96 hours after online publication and is updated daily on week days.
Initial download of the metrics may take a while.