Fig. 11
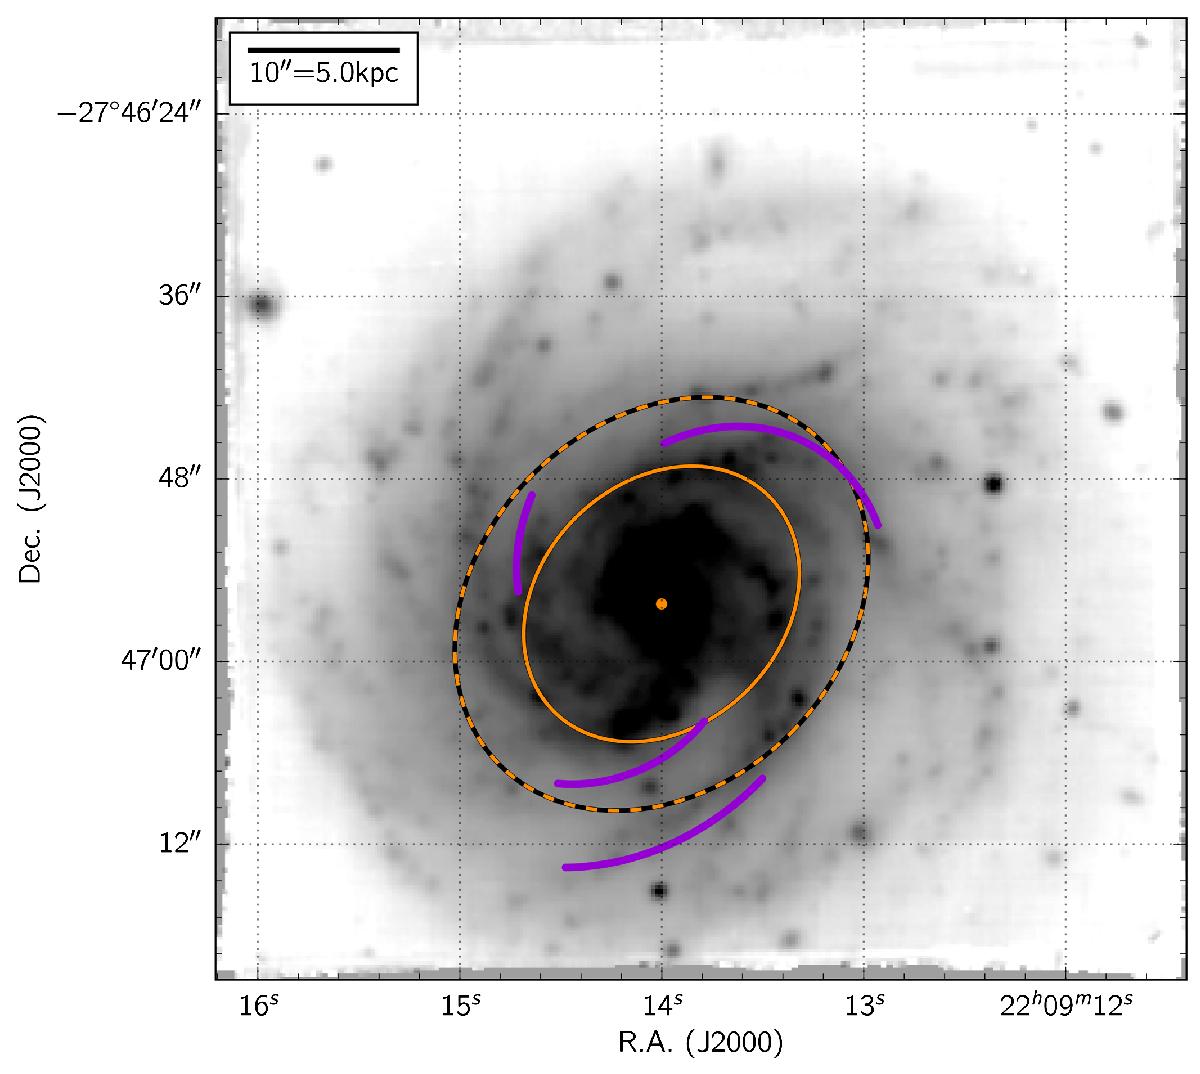
White-light image of HCG 91c, reconstructed by collapsing the entire MUSE datacube. The galaxy center is marked with an orange dot. The projected effective radius Re and 1.5 Re ellipses are shown in orange and dashed-orange, respectively. The location of the coherent, kpc-scale variations of the oxygen abundance traced in Fig. 10 are shown with purple curves. These effectively trace the edge of several of the spiral structures of HCG 91c.
Current usage metrics show cumulative count of Article Views (full-text article views including HTML views, PDF and ePub downloads, according to the available data) and Abstracts Views on Vision4Press platform.
Data correspond to usage on the plateform after 2015. The current usage metrics is available 48-96 hours after online publication and is updated daily on week days.
Initial download of the metrics may take a while.