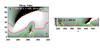
Fig. 8
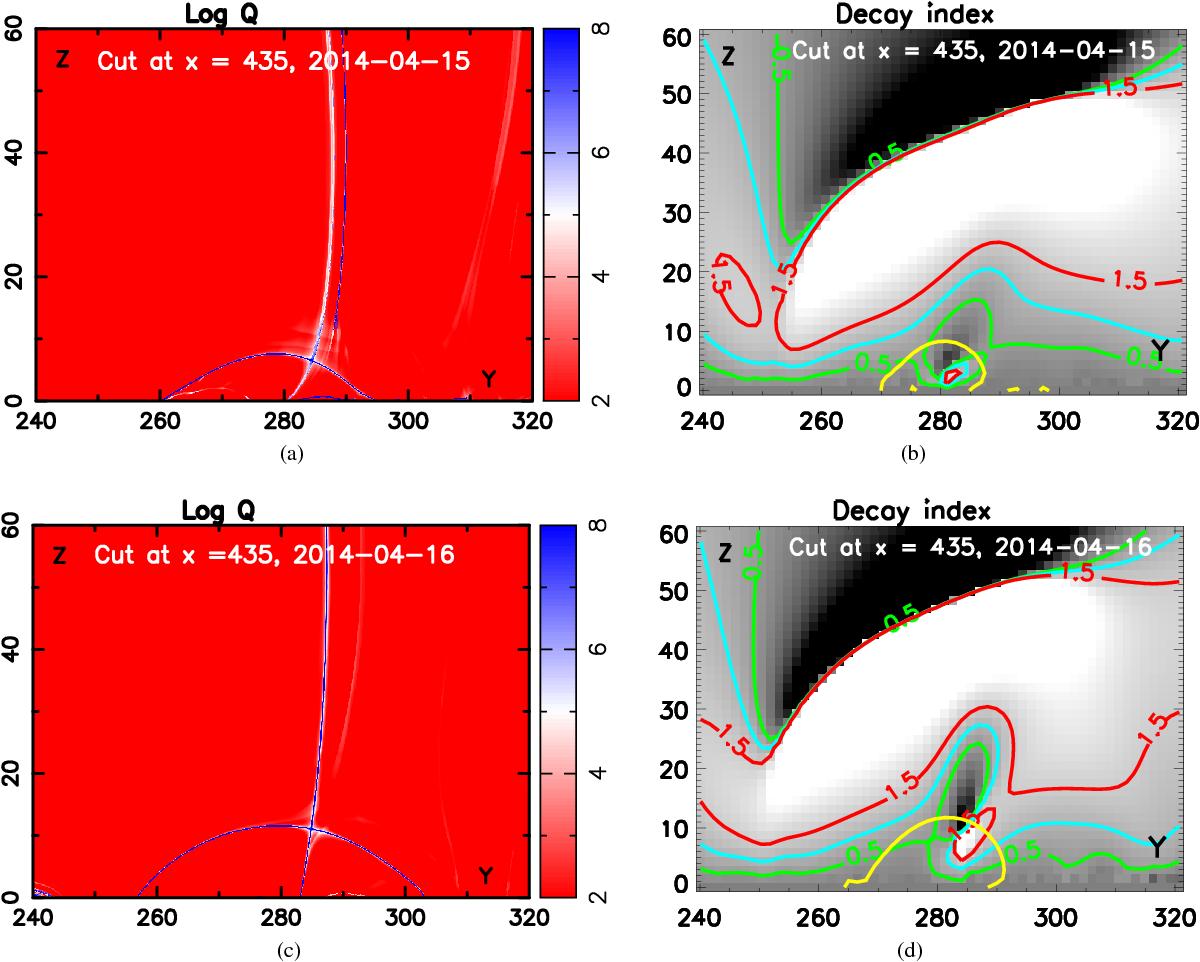
Projected 2D view of the squashing degree Q (left panels, see Sect. 3) and of the decay index (gray color scale, right panels) along a plane passing through x = 435 (see Fig. 7). The HFT corresponds to the intersection of the two high Q regions in the left panels. The green, cyan, and red contours on the right panels indicate isocontours of decay index n = 0.5,1, and 1.5, respectively. The yellow contour indicates the polarity inversion line. Axis units are in Mm from the bottom left corner of the larger remapped HMI/LOS magnetogram used to perform the potential field extrapolation (resp. from the photosphere) for the abscissa (resp. the ordinate).
Current usage metrics show cumulative count of Article Views (full-text article views including HTML views, PDF and ePub downloads, according to the available data) and Abstracts Views on Vision4Press platform.
Data correspond to usage on the plateform after 2015. The current usage metrics is available 48-96 hours after online publication and is updated daily on week days.
Initial download of the metrics may take a while.