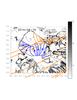
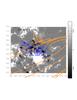
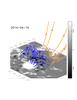
Fig. 7
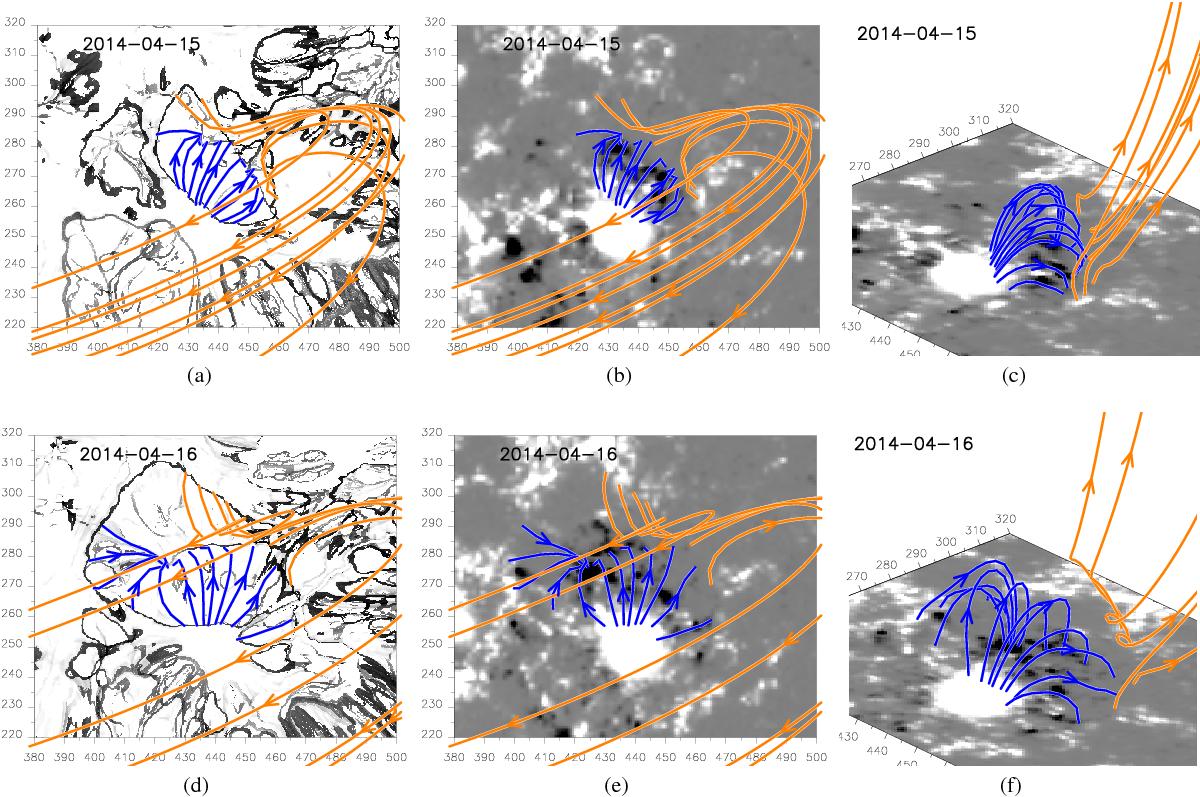
Zoomed-in views of the distribution of the QSL maps at z = 0.4 Mm (gray color scale, left) and of the photospheric (line-of-sight component) magnetic field (gray color scale, middle, right), as well as selected magnetic field lines for April 15 (top) and April 16 (bottom). For better visibility field lines in panels (c), f)) are vertically stretched by a factor of 2. The color scale for the magnetic field is saturated at ±300 Gauss and black/white indicates a negative/positive magnetic field.
Current usage metrics show cumulative count of Article Views (full-text article views including HTML views, PDF and ePub downloads, according to the available data) and Abstracts Views on Vision4Press platform.
Data correspond to usage on the plateform after 2015. The current usage metrics is available 48-96 hours after online publication and is updated daily on week days.
Initial download of the metrics may take a while.