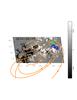
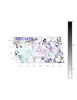
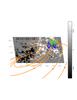
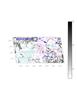
Fig. 6

Magnetic field distribution (LOS component) of AR 12035 together with some representative potential field lines (left panels) and QSL maps (right panels) for April 15 (top) and April 16 (bottom). The QSL maps (gray color scale) are computed at z = 0.4 Mm above the photosphere (see Sect. 3.2). The color scale for the magnetic field is saturated at ±300 Gauss and black/white indicates a negative/positive magnetic field, while the magenta/cyan contours indicate positive/negative magnetic field values of ±100, ±300, ±500, ±700, and ±900 Gauss. The axis indicates Mm from the bottom left corner of the larger remapped HMI LOS magnetogram and is used to perform the potential field extrapolation (see Sect. 3.1 for more detail). Q1 and Q2 indicate the QSLs relevant for the eruption, while JR indicates the region where the recurrent jets occurred (see Sect. 3.2).
Current usage metrics show cumulative count of Article Views (full-text article views including HTML views, PDF and ePub downloads, according to the available data) and Abstracts Views on Vision4Press platform.
Data correspond to usage on the plateform after 2015. The current usage metrics is available 48-96 hours after online publication and is updated daily on week days.
Initial download of the metrics may take a while.