Fig. 5
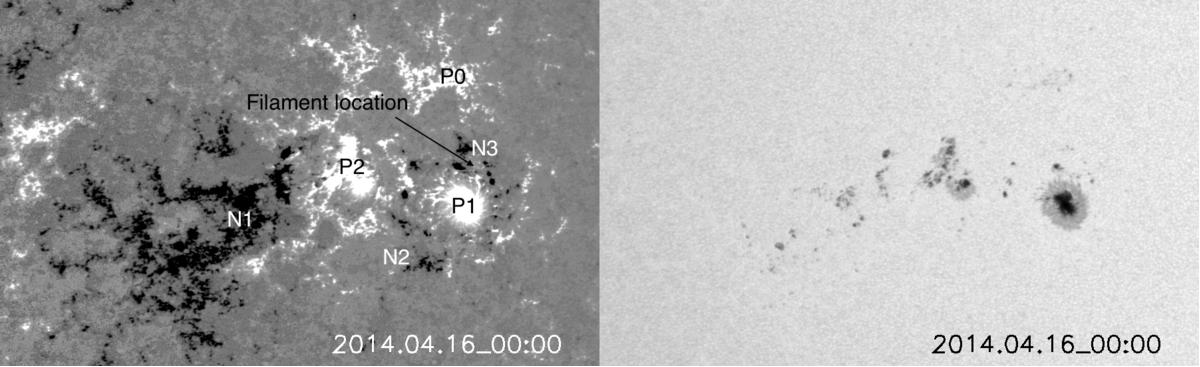
HMI SHARP data projected and remapped to a cylindrical equal area (CEA) Cartesian coordinate system. Distribution of the radial component of the magnetic field (left) and of the HMI continuum (right). The FOV is [901 × 551] CEA pixels. The color scale for the magnetic field is saturated at ±500 Gauss and black/white indicates a negative/positive magnetic field. P0, P1, and P2 (resp. N1, N2, and N3) indicate different relevant positive (resp. negative) magnetic field distributions discussed in the text. The temporal evolution is shown in Movie 3 (available online).
Current usage metrics show cumulative count of Article Views (full-text article views including HTML views, PDF and ePub downloads, according to the available data) and Abstracts Views on Vision4Press platform.
Data correspond to usage on the plateform after 2015. The current usage metrics is available 48-96 hours after online publication and is updated daily on week days.
Initial download of the metrics may take a while.