Fig. 4
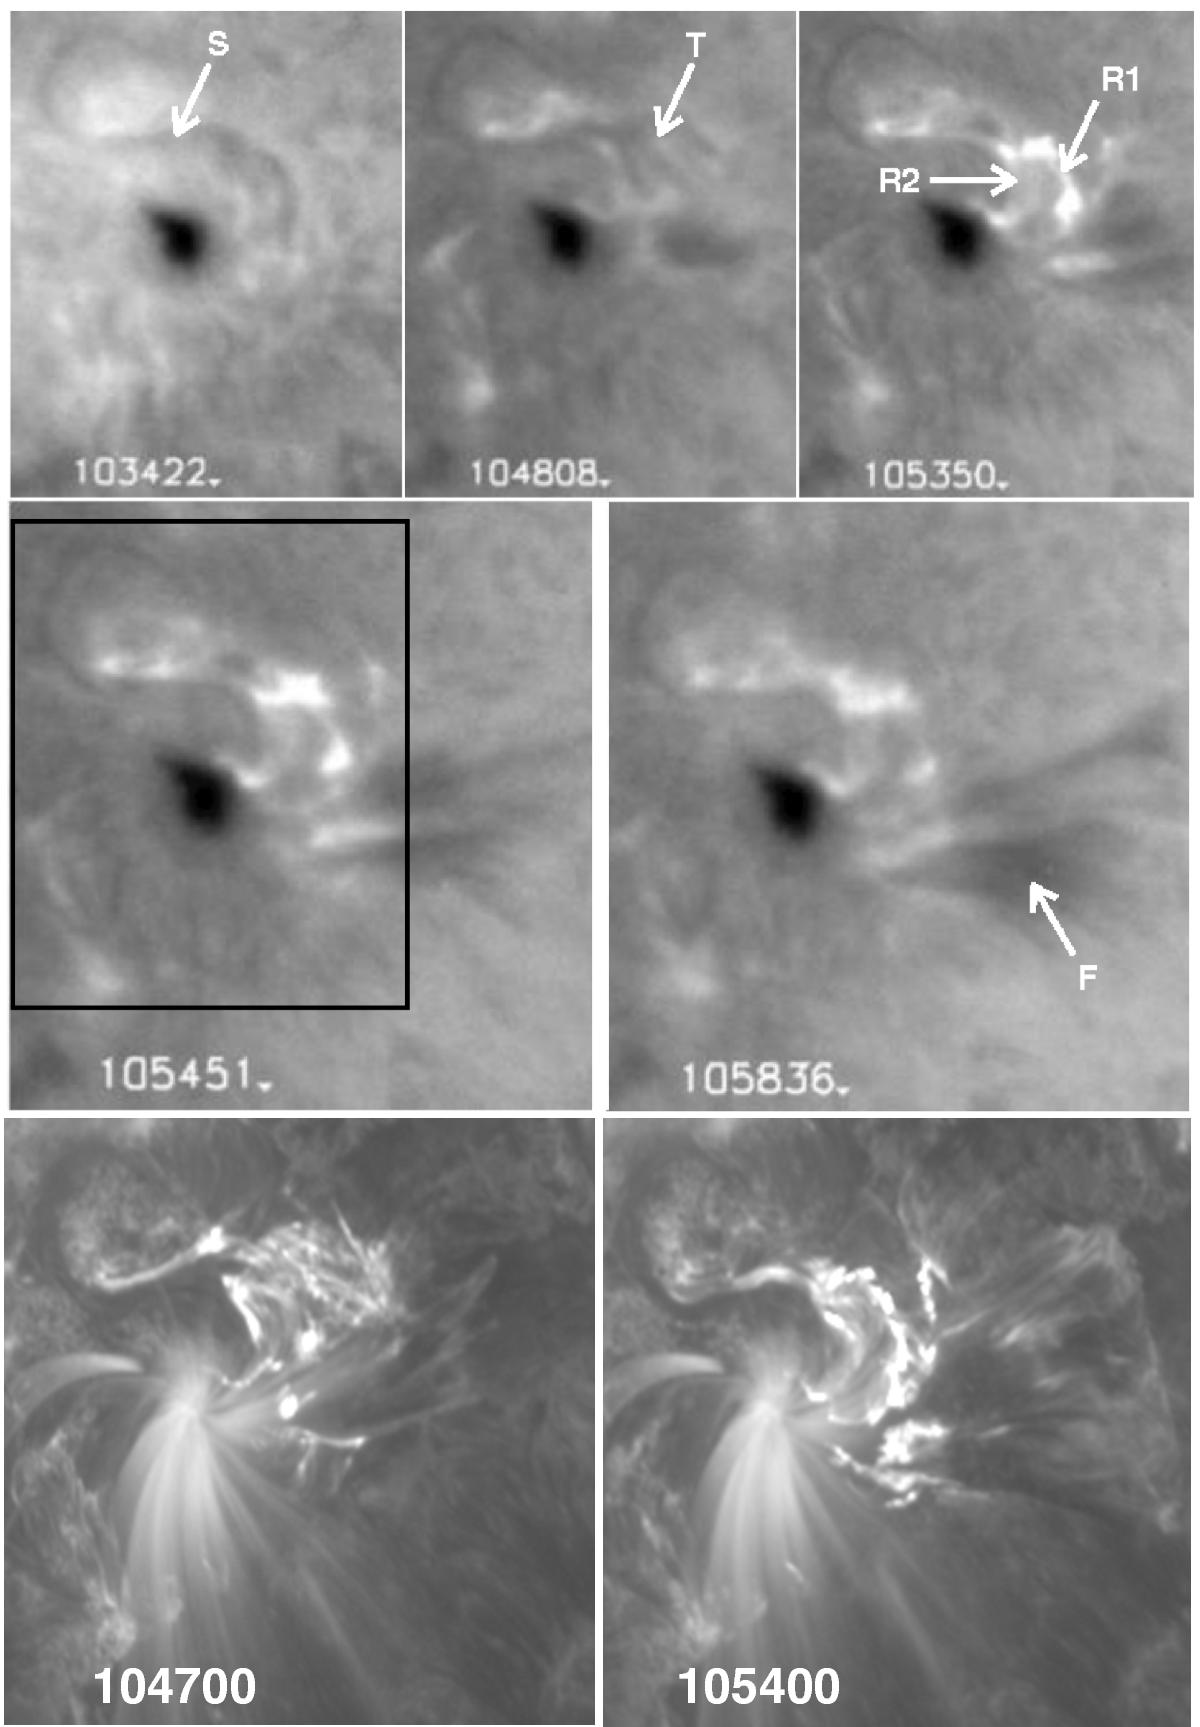
Hα images of the failed filament eruption and of the flare on 2014 April 16 from 10:34−10:58 UT (from Nainital ARIES telescope, top rows). The box in the left middle image represents the FOV of the images in the top row. In the bottom row, the corresponding images in AIA 171 Å at 10:47UT and 10:54 UT are shown. The FOV of the bottom panels is similar to the FOV of the middle panels. See text for more details on the S-shaped filament (S), the multiple threads (T), the two bright flare ribbons (R1, R2), and the black fan-like shapes (F).
Current usage metrics show cumulative count of Article Views (full-text article views including HTML views, PDF and ePub downloads, according to the available data) and Abstracts Views on Vision4Press platform.
Data correspond to usage on the plateform after 2015. The current usage metrics is available 48-96 hours after online publication and is updated daily on week days.
Initial download of the metrics may take a while.