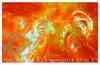
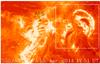
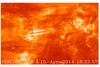
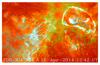
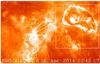
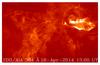
Fig. 2
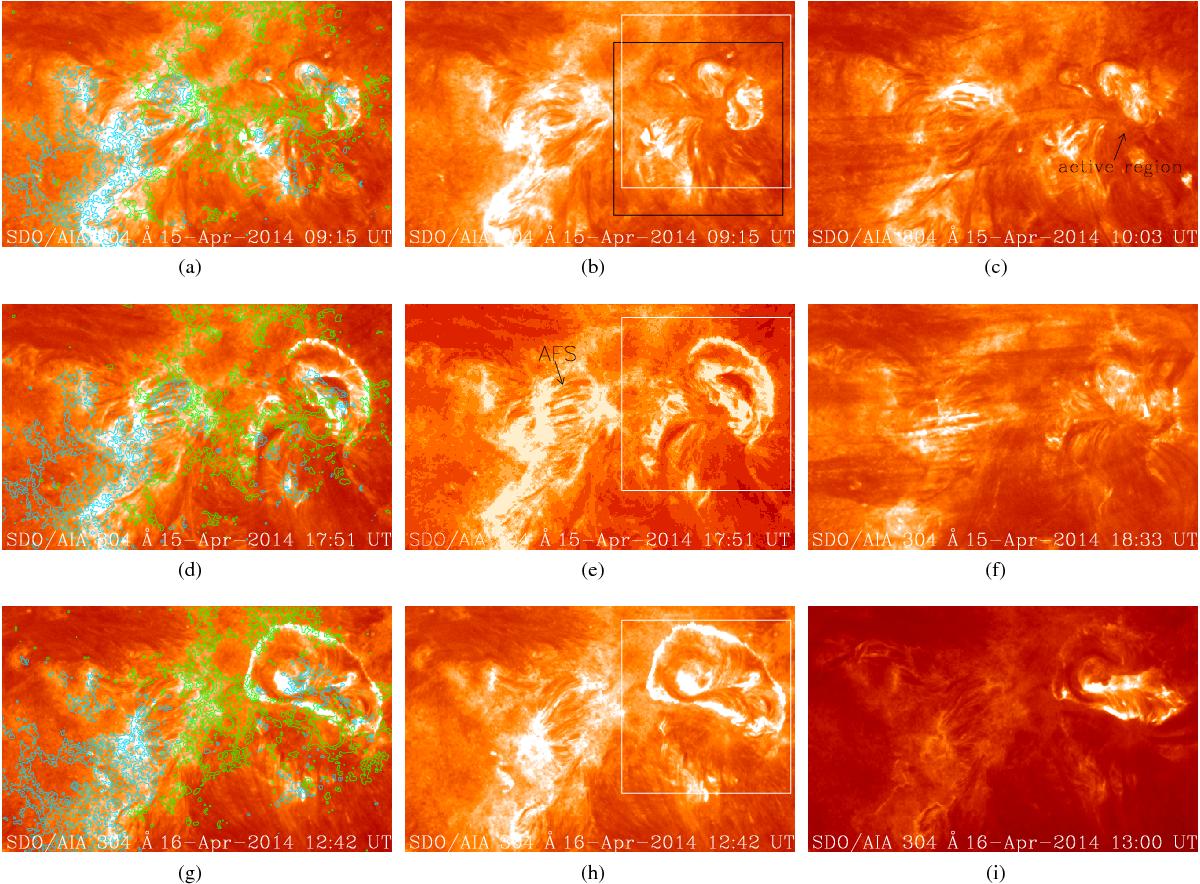
Two examples of the C-class eruptive flares in the AR 12035 on 2014 April 15 in AIA 304 Å (two top rows) and one example of confined flare on 2014 April 16 (bottom row). The FOV is [300 × 200] arcsec and the active region corresponds to the bright region on the right side of the images indicated by an arrow in panel c). The arch filament system (AFS) discussed in Sect. 2.4 is indicated by an arrow in panel e). The left column images are overlaid by HMI LOS magnetic field contours. Green/cyan contours (levels: ±100, ±500, ±900) represent positive/negative polarity, respectively. The black square in panel b) indicates the approximate FOV of Fig. 3, while the white square indicates the approximate FOV of Fig. 7. The temporal evolution is shown in Movie 1 (available online).
Current usage metrics show cumulative count of Article Views (full-text article views including HTML views, PDF and ePub downloads, according to the available data) and Abstracts Views on Vision4Press platform.
Data correspond to usage on the plateform after 2015. The current usage metrics is available 48-96 hours after online publication and is updated daily on week days.
Initial download of the metrics may take a while.