Free Access
Fig. 3
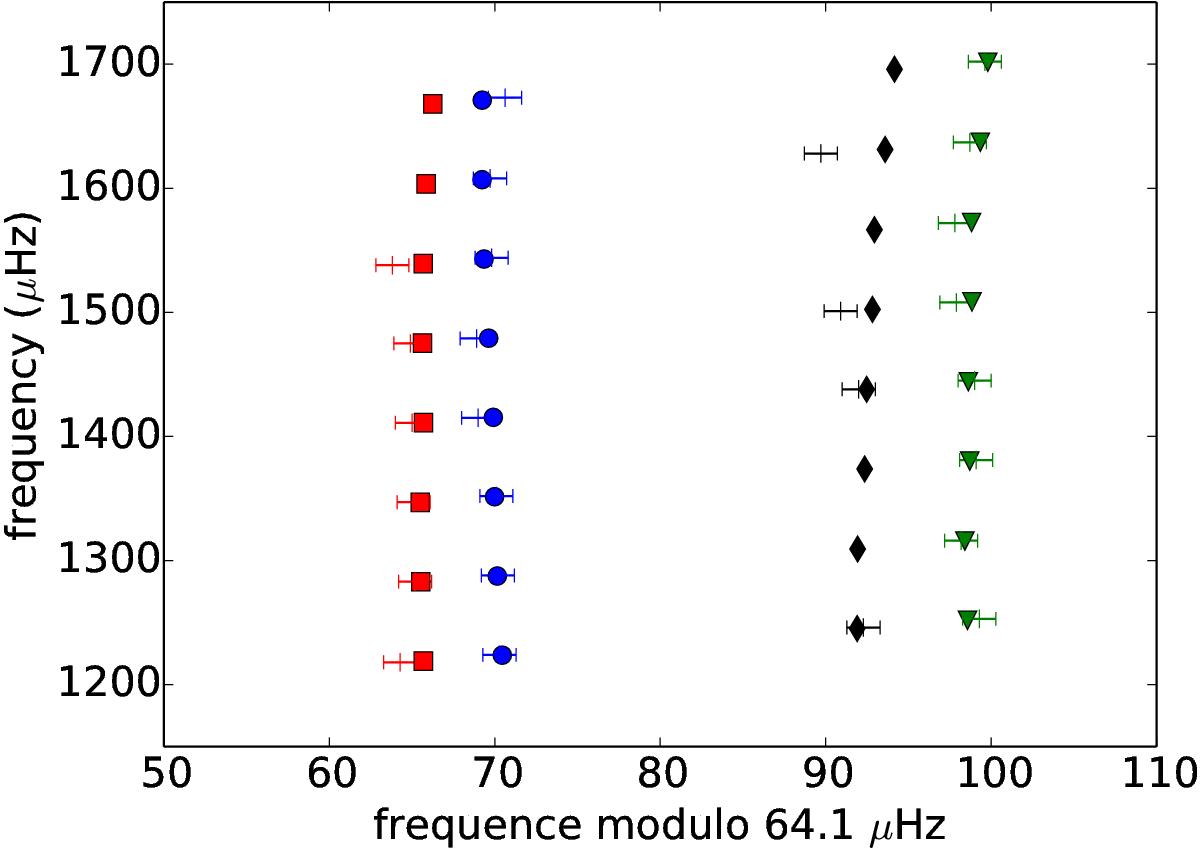
Echelle diagram of the 1.44 M⊙ at 2.38 Gyr. The frequencies computed for the models with Yinit = 0.297 and Zinit = 0.0305 are represented by blue dots (l = 0), green triangles (l = 1), red squares (l = 2), and black diamonds (l = 3). The observed frequencies are represented by crosses (error bars: 1 μHz).
Current usage metrics show cumulative count of Article Views (full-text article views including HTML views, PDF and ePub downloads, according to the available data) and Abstracts Views on Vision4Press platform.
Data correspond to usage on the plateform after 2015. The current usage metrics is available 48-96 hours after online publication and is updated daily on week days.
Initial download of the metrics may take a while.